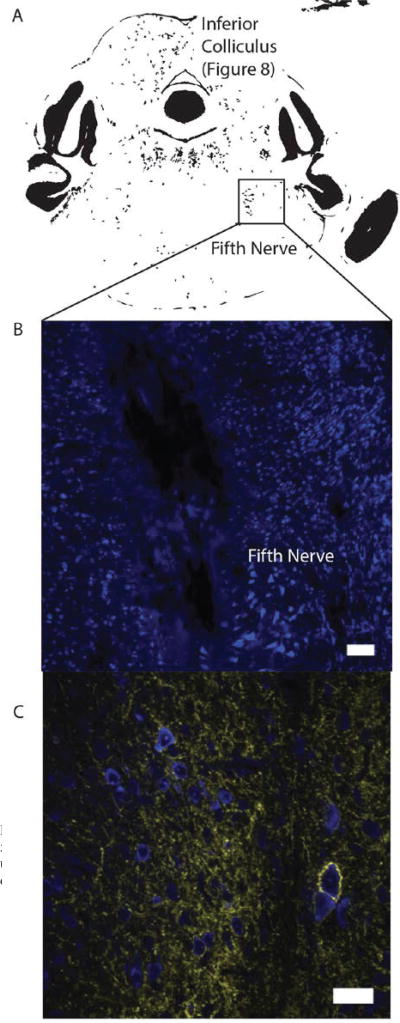
Fig. 12.
(A) A gerbil brain atlas showing recording sites for the measurements of Figs 8 and 9 for optogenetic inhibition. (B) Post-mortem histological image of Nissl staining (blue) surrounding the recording site (white bar = 100 µm) (C) Histological image of the same brain slice of (B) showing both Nissl (blue) and Halorhodopsin (yellow, yellow fluorescent protein-YFP). There was extensive Halorhodopsin expression near the recording site as indicated by YFP expression. (white bar = 25 µm).

