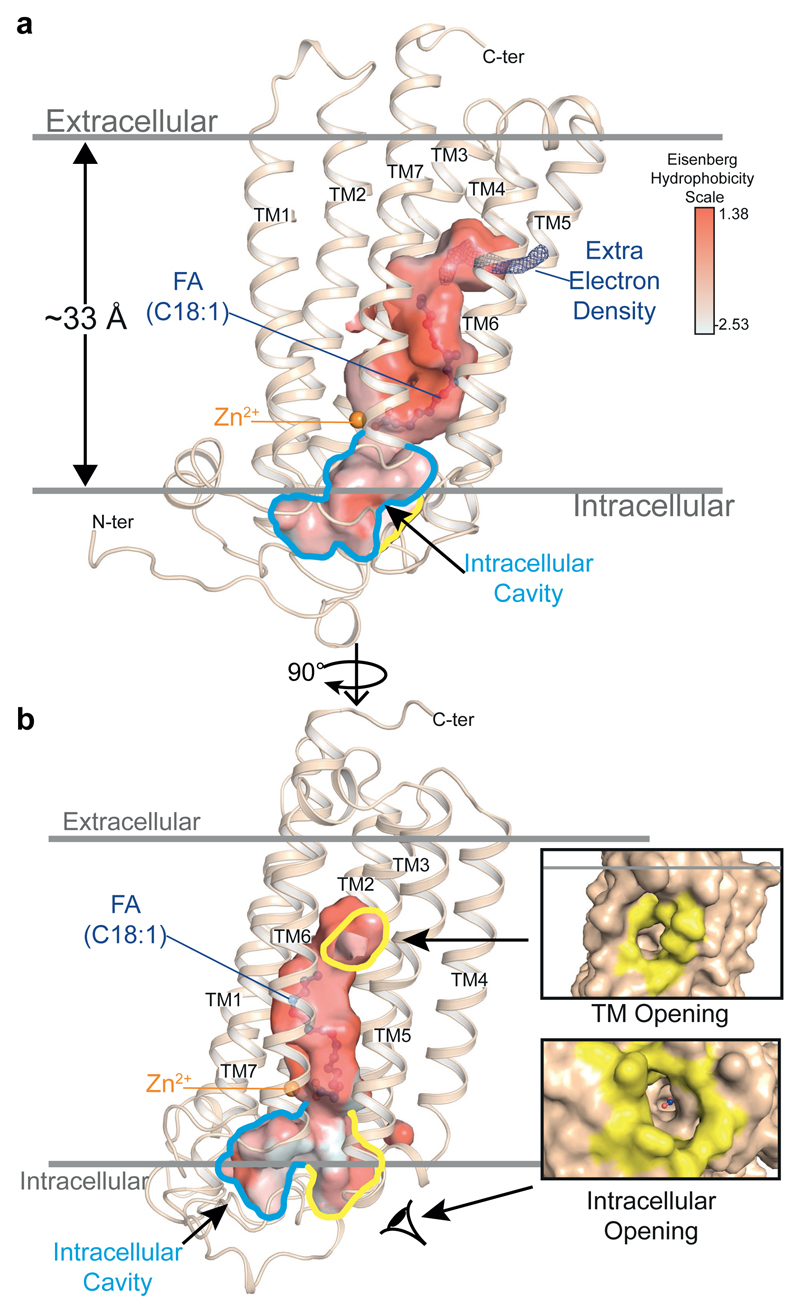
Figure 2. A continuous cavity in the ADIPOR2 structure.
The large internal cavity is shown as surface (cavity mode 1) and coloured according to the Eisenberg hydrophobicity classification. (a) The extra electron density (2Fo-Fc contoured at 1σ) is shown in dark blue. The intracellular cavity extruding towards the N-terminus domain/TM1/TM2 is contoured in blue. (b) Highlighted in yellow are the two openings accessible to solvent (TM opening/Intracellular opening, shown in insets as surface views). The zinc ion and oleic acid are represented and coloured as in Fig. 1.

