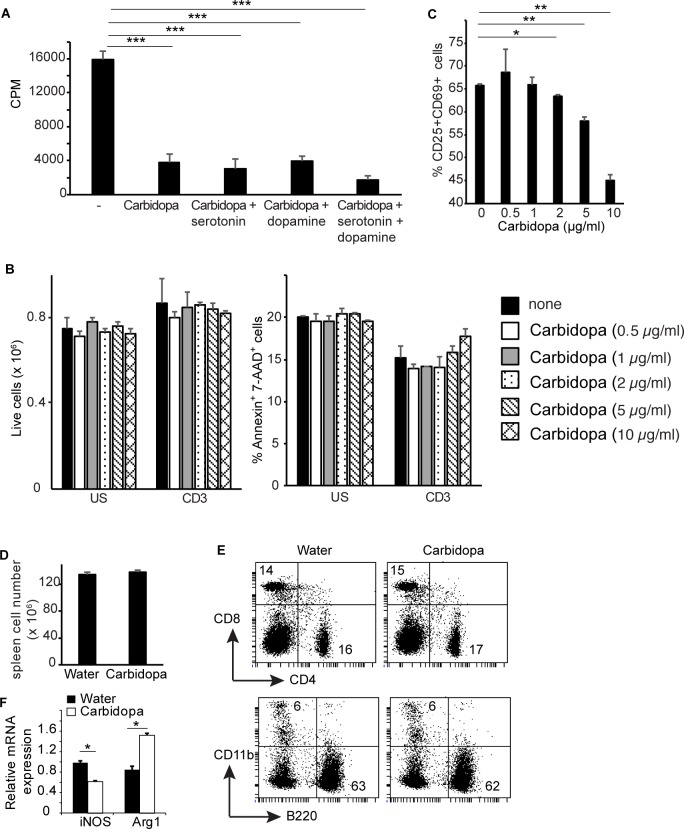
Fig 2. Carbidopa inhibits early events in T cell activation.
A, T cells were activated with anti-CD3 in the presence or absence of carbidopa (5 μg/ml). Serotonin (10 μg/ml) and dopamine (10 μg/ml) were added to the indicated cultures and proliferation of T cells was determined as above. Error bars represent standard deviation triplicates. B, Total number of live cells (left panel) and frequency of annexin-V+ 7-AAD+ cells (right panel) recovered following overnight culture of T cells in the presence or absence of indicated concentration of carbidopa and anti-CD3. Error bar represent standard deviation of duplicates. C, Frequency of CD4+ T cells expressing CD25 and CD69 in response to plate bound anti-CD3 overnight activation in the presence or absence of indicated dosage of carbidopa. Unstimulated culture contained 0.2% CD25+CD69+ cells. D, Total number of live cells from spleen of mice treated with carbidopa as in Fig 1B (n = 4). E, Frequency of CD4+, CD8+, B220+ and CD11b+ cells in spleens of mice from D. The numbers represent the percent positive cells in the corresponding quadrants. F, Expression of iNOS and Arg1 was measured by quantitative real time PCR in splenic CD11b+ of mice from D. Error bars represent the standard deviation of mean (n = 3). *P = <0.05, **P = <0.005 and ***P = <0.0005, P value <0.05 were considered significant.

