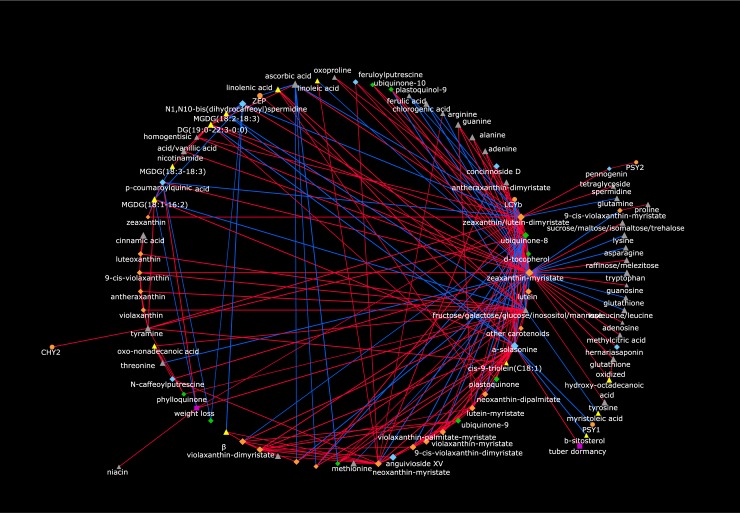
Fig 9. Correlation network of carotenoid transcripts, metabolites and post-harvest traits.
Pearson correlation (r) coefficients were generated by using fold change-Daifla values. Node shape is according the kind of data (transcript: round; primary metabolite: triangle; secondary metabolite: diamond; post-harvest phenotype: square). Node colors identify compounds belonging to different pathways (semi-polar primary metabolite: gray; non polar primary metabolite: yellow; carotenoid: orange; semi-polar secondary metabolite: light blue; isoprenoid: green) or a post-harvest phenotype (violet). Node size is proportional to node strength (ns). Red and blue edges refer to, respectively, positive and negative correlations. Edge thickness is according the corresponding |ρ|. Only ρ > |0.90| are shown. Regions populated by nodes displaying a large number of significant positive and negative correlations are magnified.

