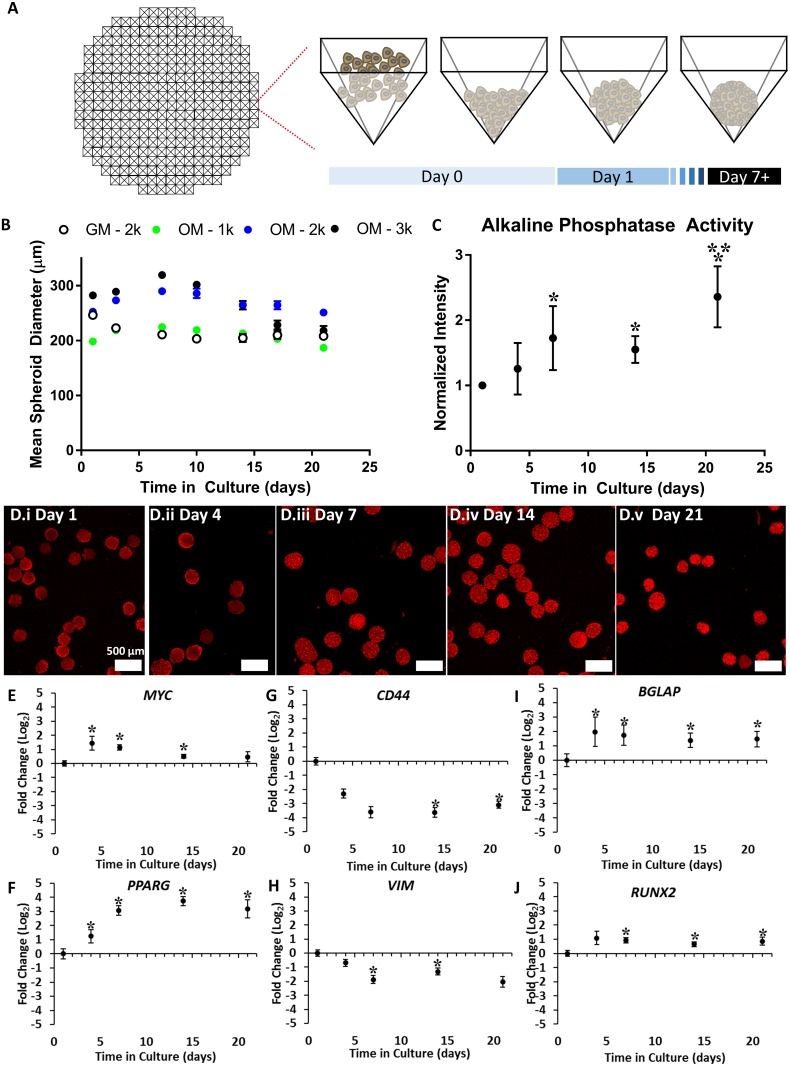
Fig 1. Characterization of HWJSC spheroids and time-course of osteogenic differentiation.
A: Schematic of HWJSC spheroid generation in agarose microwells, generated using AggreWell 800 as a template. B: Data representing the mean spheroid diameter of HWJSC spheroids at three different initial seeding densities (1k, 2k, 3k HWJSCs per spheroid) and in either osteogenic differentiation medium (OM) or growth medium (GM). HWJSCs were seeded in GM on day 0 and were subsequently cultured at day 1 and beyond in either OM or GM for the remainder of the culture (with medium changes every 2–3 days). HWJSC spheroid mean diameter ± 95% confidence interval was calculated for 40 spheroids per condition per time point from one representative experiment. C: Quantified mean intensity of 2k HWJSC spheroids cultured in OM and stained using an alkaline phosphatase substrate kit. Data are presented as the mean fluorescence intensity ± SEM for three independent experiments, normalized to the day 1 time point. Asterisks denote statistical significance calculated on raw mean intensity values at α = 0.05 of each condition relative to the day 1 and day 4 time points (*) or relative to the day 7 and day 14 time points (**) using two-way ANOVA and Tukey’s post-hoc test. D: Fluorescent micrographs representing maximum intensity projections of HWJSC spheroids that were stained for alkaline phosphatase activity at the indicated time point after the initiation of spheroid culture. Scale bar represents 200 μm. E-J: Fold change in gene expression over time of 2k HWJSC spheroids cultured in OM. Data represent fold change relative to GAPDH housekeeping gene and the day 1time point for MYC (E), PPARG (F), CD44 (G), VIM (H), BGLAP (I), and RUNX2 (J). Asterisks denote statistical significance relative to a mean value of ‘1’ using a one-tailed Student’s t-test (α = 0.05) for three independent experiments.

