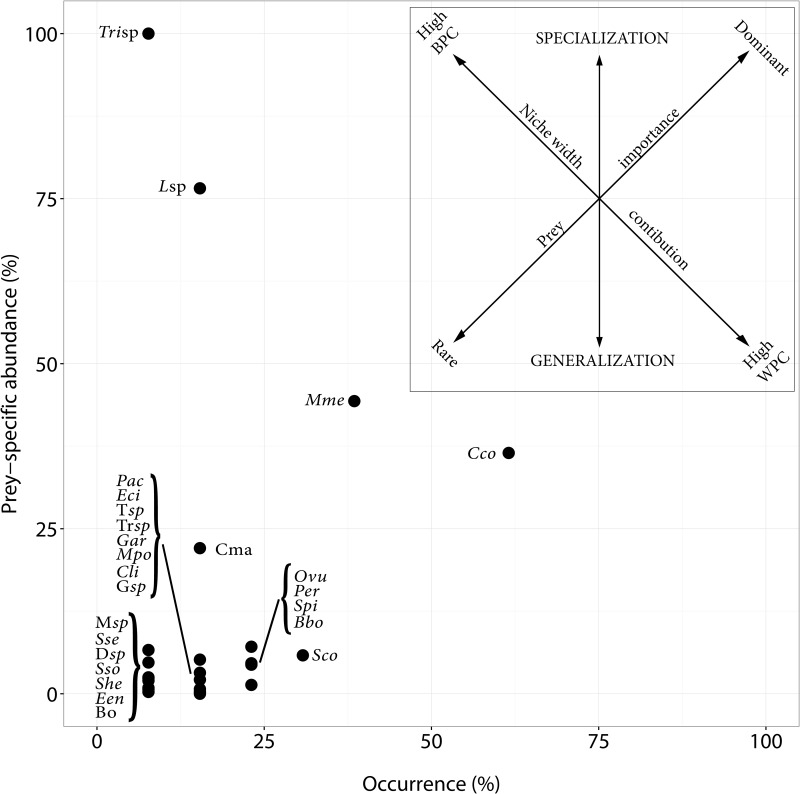
Fig 1. Prey-specific abundance plotted against frequency of occurrence of prey species for bottlenose dolphin from the Gulf of Cadiz.
Explanatory axes for foraging patterns are those of Costello (1990) as modified from Amundsen et al. (1996). The two diagonal axes represent the importance of prey (dominant vs rare) and the contribution to the niche width (between-phenotype (BPC) vs within-phenotype contribution (WPC)); the vertical axis defines the predator feeding strategy (specialist vs generalist). Trisp: Trisopterus sp.; Lsp: Liza sp.; Mme: Merluccius merluccius; Cco: Conger conger; Cma: Cepola macrophthalma; Msp: Mugil sp.; Sse: Solea senegalensis; Dsp: Diplodus sp.; Sso: Solea solea; She: Serranus hepatus; Een: Engraulis encraulicolus; Bo: Bothidae; Pac: Pagellus acarne; Eci: Eledone cirrhosa; Tsp: Trachurus sp.; Trsp: Trisopterus sp.; Gar: Gadiculus argenteus; Mpo: Micromessistius poutassou; Cli: Citharus linguatula; Gsp: Gobidae; Ovu: Octopus vulgaris; Per: Pagellus erythrinus; Spi: Sardina pilchardus; Bbo: Boops boops; Sco: Scomber colias.

