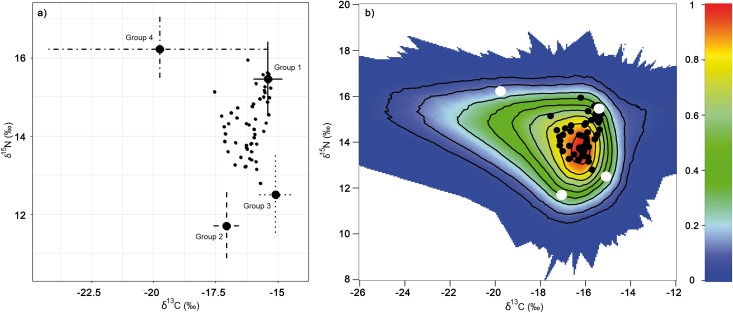
Fig 2.
a) Biplot of stable isotope signatures of bottlenose dolphins (small black dots) and potential dietary sources represented with the mean value of each group and the 95% confidence intervals which incorporate the error in the source isotopic signatures and in the diet-to-tissue discrimination factors. b) Mixing polygon for biplot a; bottlenose dolphins are represented with black dots and potential dietary source groups with white crosses. Probability contours are drawn every 10% level. Group 1: Diplodus annularis, Diplodus bellottii, Plectorhinchus mediterraneus and Pagellus erythrinus; Group 2: Merluccius merluccius, Scomber colias, Scomber japonicus, Scomber scombrus, Conger conger, Cepola macrophthalma and Sardina pilchardus; Group 3: Octopus vulgaris; Group 4: Liza ramada.

