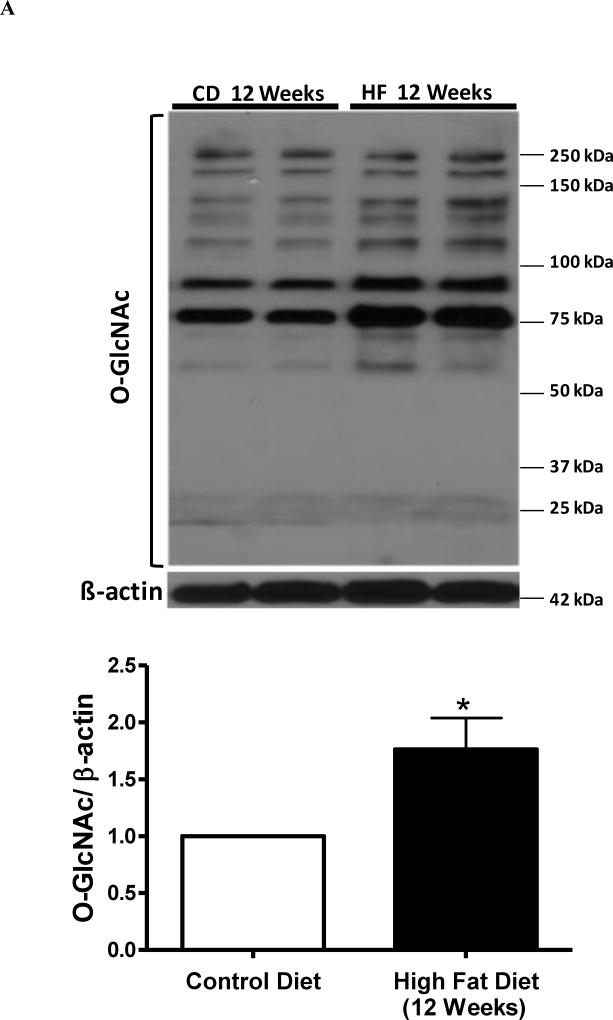
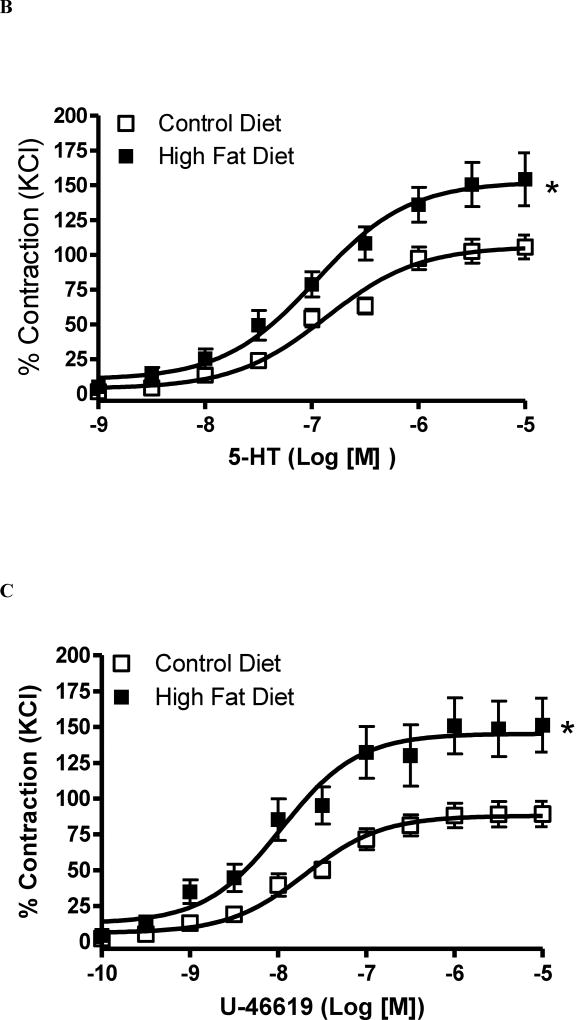
Figure 2. High fat diet for 12 weeks augments O-GlcNAc levels and reactivity to 5-HT in cerebral arteries.
(A-B) - On the top, representative Western blot images of O-GlcNAc-proteins in cerebral arteries after 8 weeks (A) or 12 weeks (B) of high-fat diet (HFD); on the bottom, corresponding bar graphs showing the relative expression of O-GlcNAc-proteins after normalization to β-actin expression. (C-F) - Concentration-response curves performed in basilar arteries from rats treated with HFD for 8 weeks: 5-HT (C), U-46619 (D); or treated with HFD for 12 weeks: 5-HT (E), U-46619 (F). Experimental values of contraction were calculated relatively to the contractile response produced by KCl 120 mM, which was taken as 100%. Results are presented as mean ± SEM for n=6–9 in each experimental group. *, P<0.05 vs. control diet.


