
Figure 2. Crystal Structure of the HPV59 L1 Pentamer.
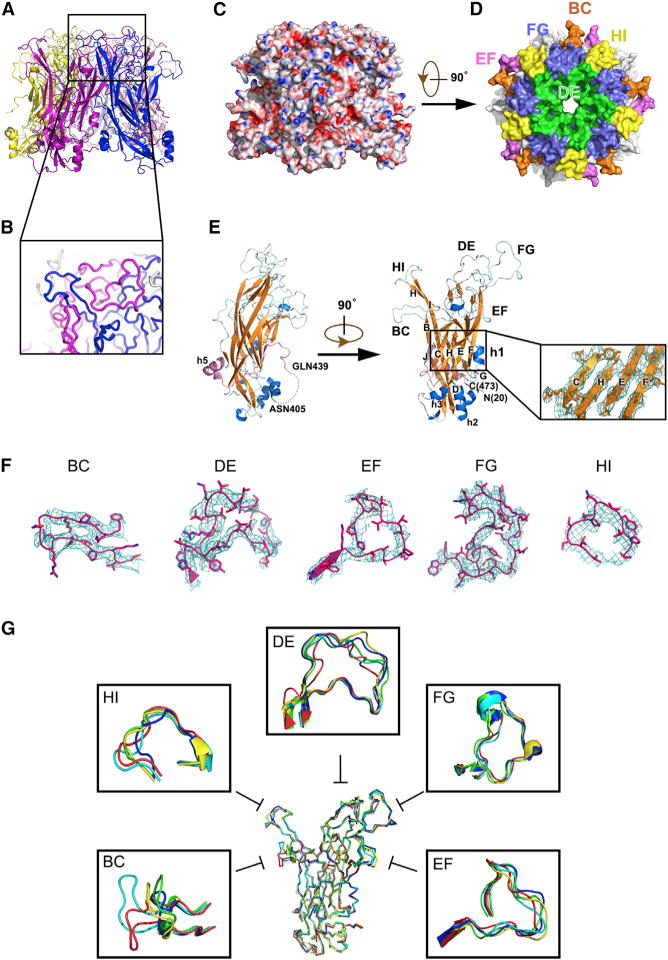
(A) Ribbon diagram of the HPV59 L1 pentamer crystal structure viewed from the side and top, respectively.
(B) Close-up view of the boxed region in (A).
(C) Side view of HPV59 L1 pentamer rendered as an electrostatic potential surface: red, blue, and white colors represent negative, positive, and neutral charge, respectively.
(D) Surface representation of the HPV59 L1 pentamer with surface loops in different colors: BC (orange), DE (green), EF (pink), FG (slate), HI (yellow).
(E) L1 monomer. The first and last residues are labeled N(20) and C(473). The β strands are colored orange and the α helices are in blue (except for h5). The connecting loops are in cyan. The C-terminal region of L1 monomer (aa 439–473) is colored pink. Strands and helices are labeled the same as the crystal structure of small HPV16 L1 VLP (PDB: 1DZL). The dotted line in the left panel signifies the missing fragment in the crystal structure between ASN405 and GLN439 due to trypsin treatment and crystallography disorder, which should be rebuilt in the complete VLP model. The inset shows the core region of L1 monomer (CHEF sheet), the 2Fo–Fc map of which is displayed at the contour level of 1.5σ.
(F) Close-up view of the five flexible surface loops of HPV59 L1. The 2Fo–Fc maps are displayed as cyan mesh at the contour level of 1.0σ.
(G) Comparison of loops in five different HPV serotypes: HPV59 (red), HPV11 (blue), HPV16 (green), HPV18 (cyan), and HPV35 (yellow).