
Figure 4. Pseudo-atomic Model of the HPV59 Capsid.
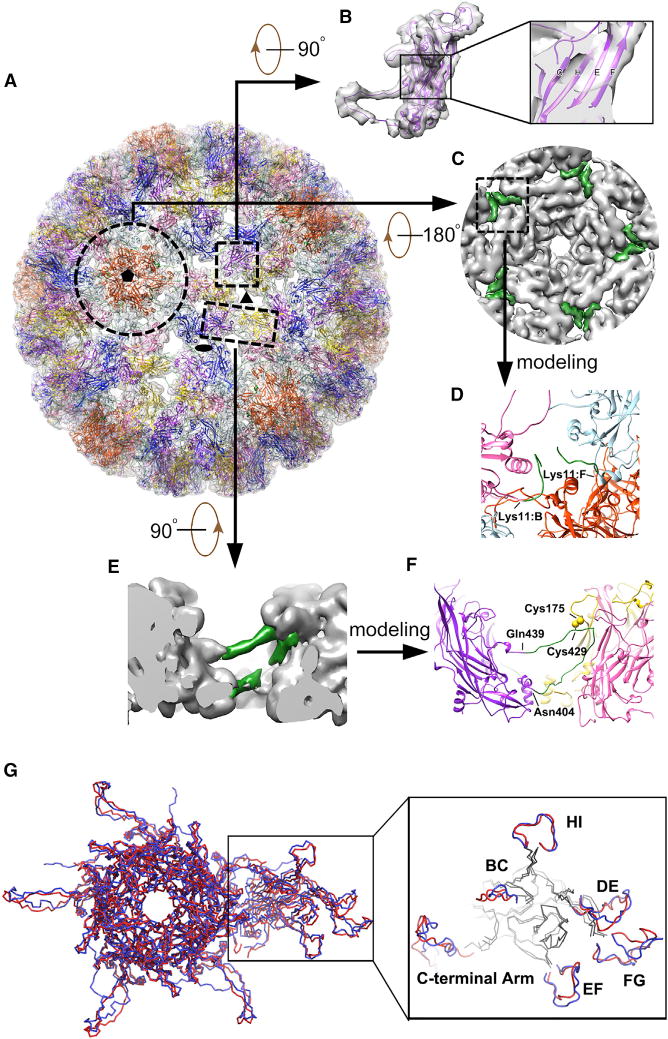
(A) Complete pseudo-atomic model of HPV59 (shown in ribbon representation) fitted into the cryo-EM density map and viewed along the axis of a 6-coordinated pentamer. Black ellipse, triangle, and pentagon symbols mark the positions of two-, three-, and five-fold axes of icosahedral symmetry, respectively. Color scheme to discriminate different L1 monomers in an asymmetric unit: chain A (light blue), chain B (pink), chain C (gold), chain D (purple), chain E (blue), and chain F (orange red).
(B) Density corresponding to one HPV59 L1 monomer and the fitted pseudo-atomic model of L1. The boxed region, shown in magnified form at the right, gives a close-up view of four β strands (C, H, E, F, respectively) in the core domain of the L1 monomer.
(C) Inside view of the 5-coordinated pentamer outlined by the broken circle in (A). Green regions, corresponding to the difference densities between the fitted crystal structures and cryo-EM map, were used to trace and build the N-terminal region of chains B and F.
(D) Close-up view of the region boxed in (C), representing the N-terminal models of chains B and F derived from the green-colored density in (C).
(E) Close-up side view of two neighboring capsomers related by icosahedral three-fold symmetry. The region colored green was the difference density between the fitted crystal structure and cryo-EM map, and was used to build the model of the C-terminal arm.
(F) The same region as (E) but shown in ribbon diagram. The part in green refers to the manually built part of the model.
(G) Comparison of the asymmetric units in models of HPV59 (red) and BPV (blue). The outlined region on the right highlights structural differences in the various surface loops between these two models. The BPV model is from a cryo-EM reconstruction (Wolf et al., 2010) (PDB: 3IYJ).