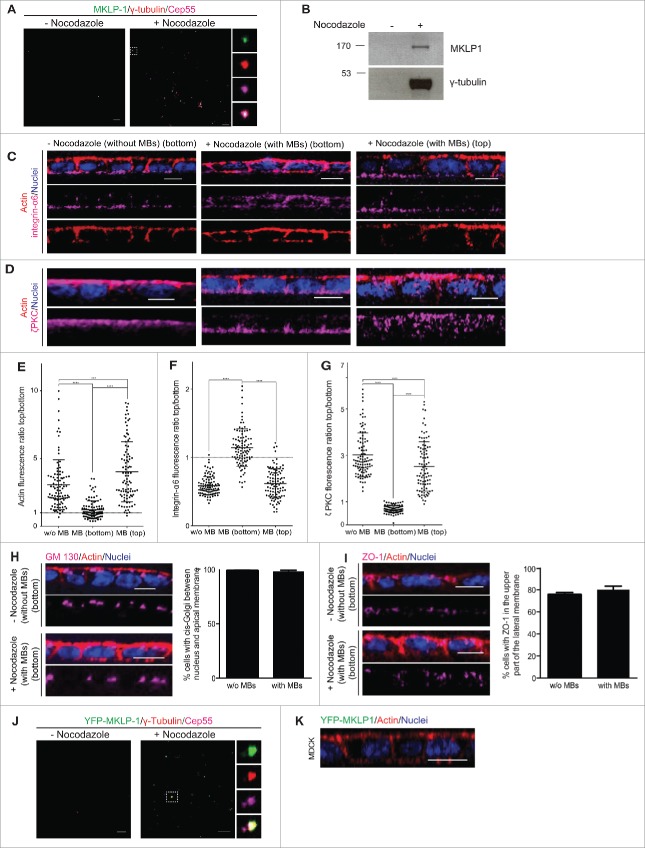
Figure 2.
The post-mitotic midbody infers apical specificity to basal membranes. (A) Representative confocal images of midbodies purified from synchronized cells (+ nocodazole) spinned down over poly-l-lysine coverslips and stained with Cep-55 (magenta), MKLP-1 (green) and γ-tubulin (red) antibodies. The same procedure from non-synchronized cells (- nocodazole) led to samples that did not contain midbodies. (B) Purified midbodies (+ nocodazole) and the control sample (- nocodazole) were immunoblotted with antibodies against MKLP-1 (upper picture) and γ-tubulin (lower picture) as midbody markers to confirm the purification. (C, D) Representative images of integrin α6 (C) or ζPKC (D) (magenta) in 2D polarized MDCK cell cultures treated with the control sample without (- nocodazole) midbodies or with the sample containing ectopic midbodies (+ nocodazole) (MBs), which both were added on top or to the bottom incubated 24 h. Actin was stained with phalloidin (red) and nuclei with Hoechst (blue). Scale bars 10 μm. E-G Fluorescence ratio between the top (apical) and the bottom (basal) membrane is represented for actin (E), integrin α6 (F) and ζPKC (G). n = 100. (H, I) Representative images of cis-Golgi marker GM130 (H) and thigh junction marker ZO-1 (I) in magenta in 2D polarized MDCK cell cultures treated with the control sample without (- nocodazole) midbodies or with the sample containing ectopic midbodies (+ nocodazole), which both were added to the bottom and incubated for 24 h. Nuclei were stained with Hoechst (blue) and actin with phalloidin (red). The percentage of cells with GM130 stained cis-Golgi present between the nucleus and the apical membrane and ZO-1 stained in the upper part of the lateral membrane was calculated. n = 90. J Purified midbodies from YFP-MKLP-1 (green) overexpressing MDCK cells and a non-synchronized control preparation were spinned down over poly-l-lysine coverslips and stained against Cep-55 (magenta) and γ-tubulin (red) to confirm the purification. Right: separated channels showing YFP-MKLP-1 (up), γ-tubulin (middle up), Cep55 (middle down) and merge (down). Scale bars 10 μm. K Representative images of 2D polarized monolayer of MDCK cells where ectopic midbodies purified from YFP-MKLP1 were delivered to the bottom or top (not shown) of the layer (n = 1950). Actin was stained with phalloidin (red) and nuclei with Hoechst (blue). Scale bars 10 μm. Values represent mean plus standard deviation of 3 experiments.

