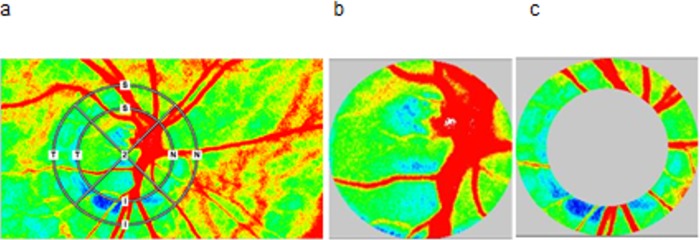
Fig 1. Laser speckle flowgraphy (LSFG) sample measurement of optic nerve head (ONH) and peripapillary region (PPR) mean blur rate in different regions.
(a). An inner elliptical band was manually fitted to ONH borders; the obtained area represents the ONH area (b). The correct identification of the borders was optimized by comparing the LSFG image with a fundus photograph. A second outer elliptical band was obtained by increasing the length of both axes of the first ellipse by 50%. The donut-shaped area, obtained after subtraction of ONH area, represents the PPR area (c). For analysis signals from large vessels were not taken into account. In the present case the band was almost circular, but this was not the case in subjects.

