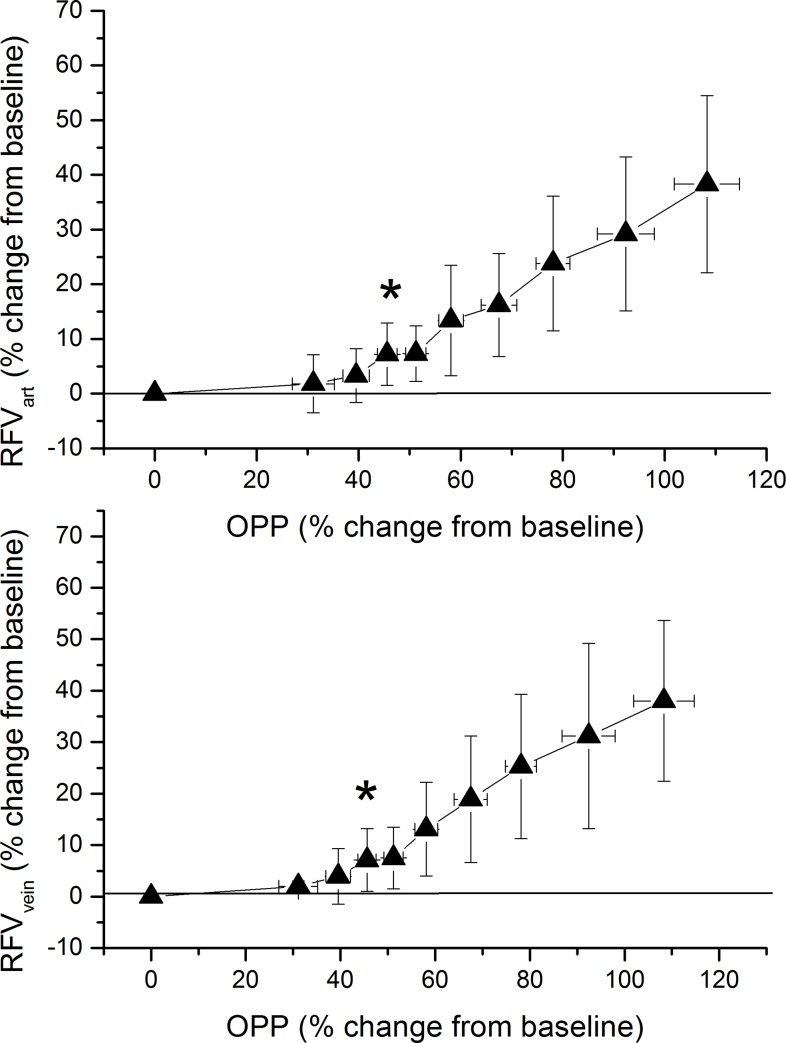
Fig 6. Pressure-flow relationship using the categorized ocular perfusion pressure (OPP)–retinal flow volume in arteries (RFVART, upper panel) and retinal flow volume in veins (RFVVEIN, during isometric exercise.
Relative data were sorted into 9 groups consisting of 18 individual values according to ascending OPP values. The means and the 95% confidence intervals are shown (n = 27). Asterisks indicate significant increase from baseline blood flow values.

