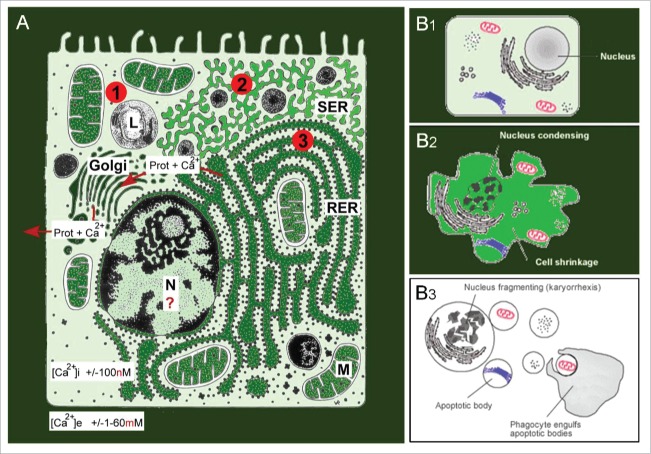
Figure 1.
A. Schematic representation of the Ca2+ gradient (adapted from ref. 15). The different shades of green are not meant to give an exact representation of differences in Ca2+-concentration. B. Ca2+-induced apoptosis resulting in cell death (adapted from Wikipedia: Apoptosis).L: lysosome, N = nucleus, M = mitochondrion, RER = rough endoplasmic reticulum, SER = smooth endoplasmic reticulum. The red dots with 1, 2, and 3 correspond to the mechanisms 1–3 for keeping [Ca2+]i low (See later).

