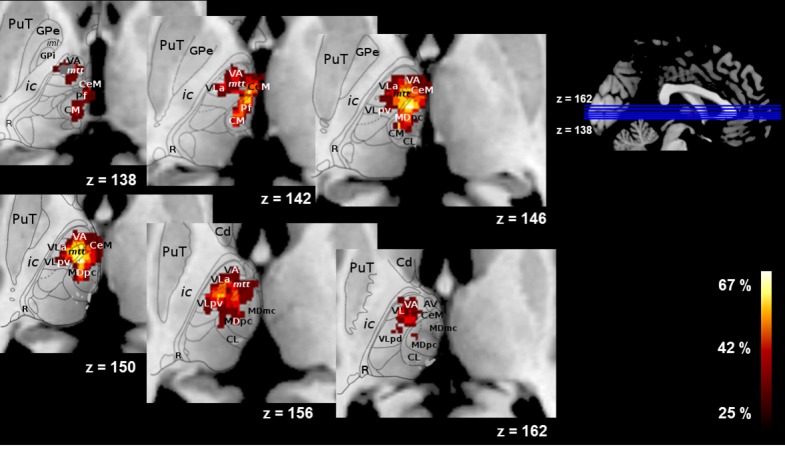
Figure 4. Overlap of the lesions across patients (% of patients, N = 12) on an axial view on the automated Morel atlas.

PuT = putamen; GPe = external globus pallidus; ic = internal capsule; R = reticular nucleus; VA = ventral anterior; mtt = mammillothalamic tract; CeM = central medial; CM = central median; CL = central lateral; Hb = habenula = MD=mediodorsal.
