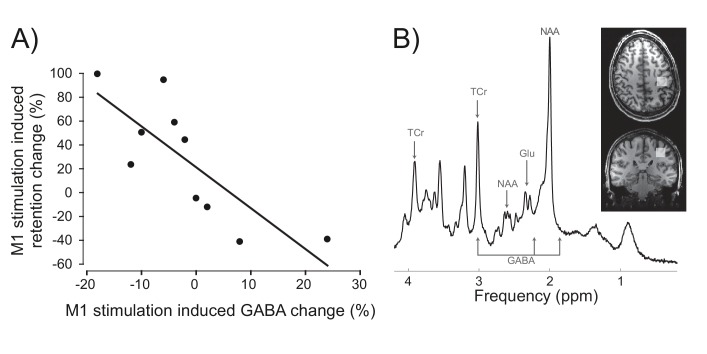
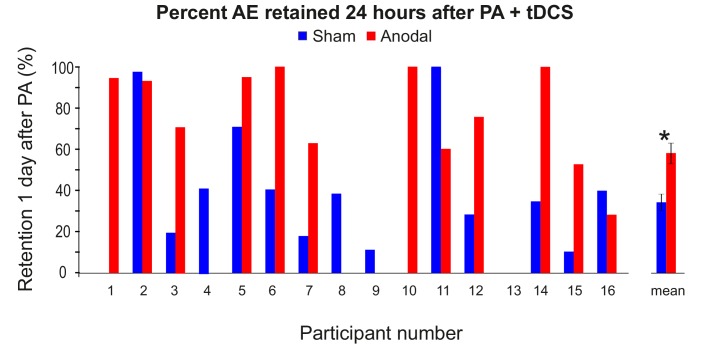
Figure 4. Inter-individual differences in neurochemical response to stimulation (M1 GABA change) co-varied with changes in prism after-effect retention caused by M1 a-tDCS.
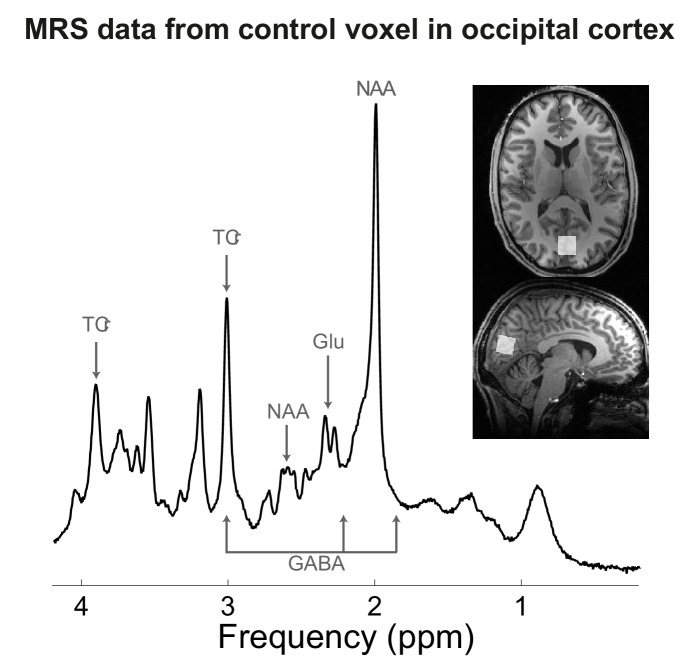
(A) Experiment 7: X-axis shows individuals' percent change in GABA concentration after M1 a-tDCS (post-pre), quantified as ratios of total creatine. Y-axis shows individuals' percent change in AE retention 24 hr after PA + tDCS (anodal-sham). Correlation (N = 10) shows quantitative covariation between the behavioural and neurochemical effects of M1 a-tDCS. Note the data pass through the origin. (B) Representative image for a single participant showing voxel placement in the hand knob region of M1 and spectral quality. Frequency spectrum labels (ppm = parts per million) indicate peaks for GABA, Glutamate (Glu), total Creatine (TCr = creatine + phosphocreatine) and N-acetylaspartate (NAA).


