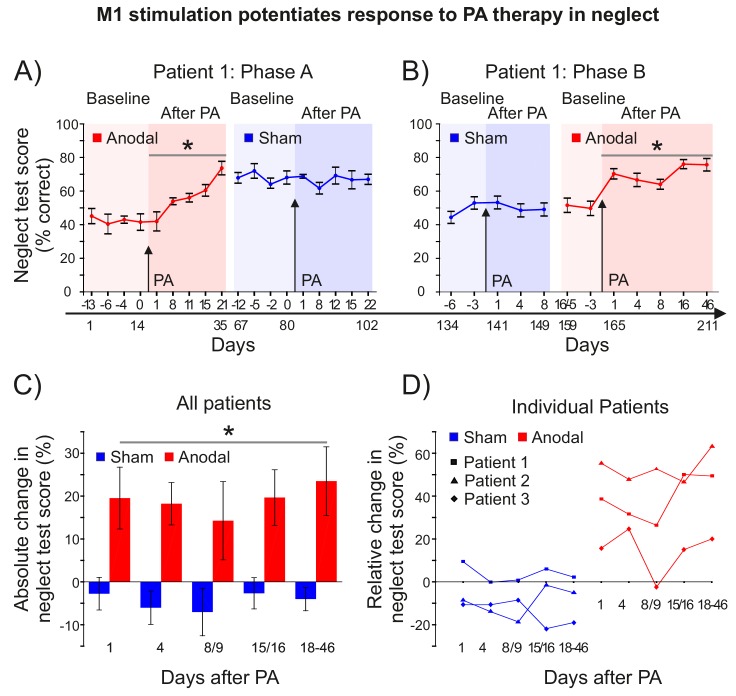
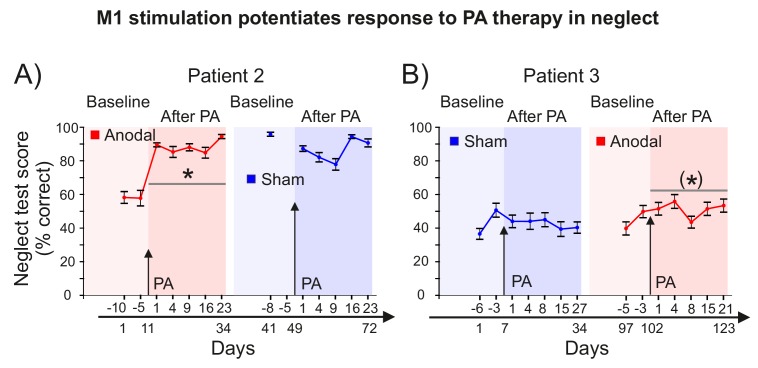
Figure 7. M1 stimulation during PA leads to lasting improvements in neglect.
(A) Behavioural measures of neglect in a single case chronic neglect patient (Patient 1) before and after PA sessions combining M1 anodal (red) and sham (blue) stimulation during adaptation. Datapoints are mean % neglect score ±1 SEM. A score of ~50% indicates the patient completed the rightmost half of the six tests in the battery. (B) As (A), but with a different battery of 10 neglect test measures, reversal of the order of anodal and sham stimulation, and no Washout phase during prism adaptation. (C, D) Percentage changes in performance on a battery of neglect tests over time after PA +M1 a-tDCS, averaged across all three patients (±1 SEM) (C), and for each individual case (D). Asterisks indicate significant improvement in neglect score after PA +M1 a-tDCS compared to sham (p<0.05).


