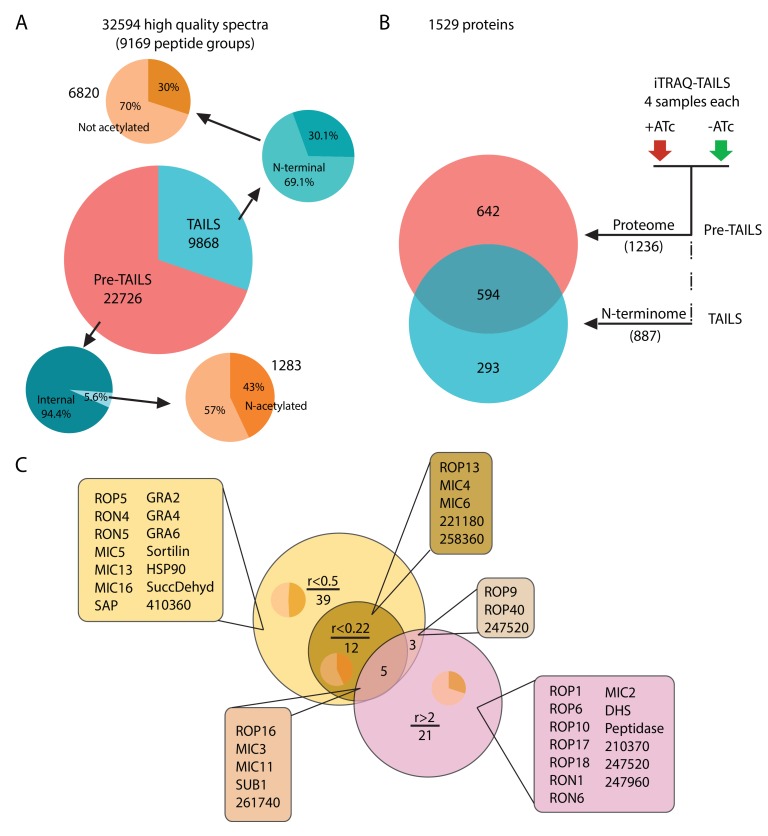
Figure 2. Global analysis of MS data and peptide ratios.
(A) All measured spectra (65’900) minus those with low quality attributes leave 32’594 high quality spectra (9169 peptide groups) for the analysis. The graphical representation depicts proportions of N-terminal peptides in the pre-TAILS and TAILS datasets (blue pie charts) and corresponding N-acetyl modifications (ochre pie charts). N-termini in the TAILS fraction are enriched by >10 fold (69% vs 6%) over internal peptides (generated by trypsin cleavage). (B) Graphical representation of the 1529 proteins in the combined datasets. Of those 642 and 293 are unique to the pre-TAILS or the TAILS fractions, respectively. (C) Graphical depiction of data generated by calculating +ATc/-ATc peptide ratios revealing ASP3-dependent processing (for details see also Table supplement 1-4). Threshold ratios (r) are indicated in the Venn diagram. Lists of proven or predicted secreted proteins represented by peptides with ratios indicated in the circles corresponding to each area in the diagram are boxed. Inset pie charts indicate the proportions of secreted (light sector) vs. cytosolic proteins (dark sector). Gene models for hypothetical proteins are indicated by the ToxoDB 6 digit designator (prefix TGGT1_).


