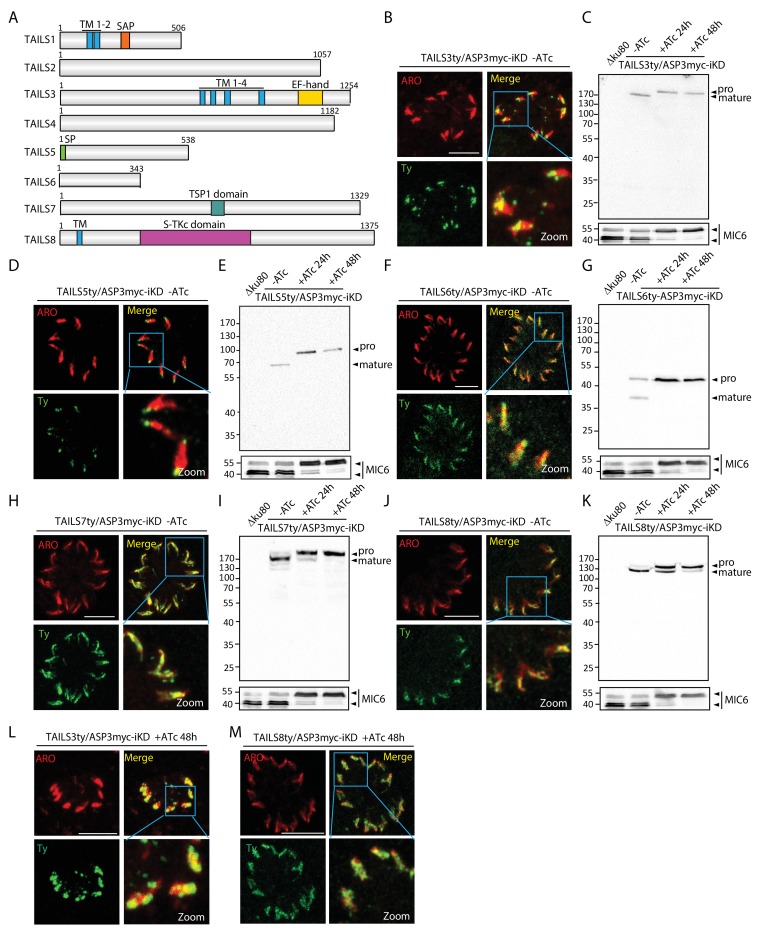
Figure 5. TAILS analysis identified new rhoptry proteins as ASP3 substrates.
(A) Schematic representation of the different candidate identified during the TAILS analysis. SP – signal peptide, TM – transmembrane, SAP - SAF-A/B, Acinus and PIAS domain, TSP1 - thrombospondin-1, S-TKc – Serine-Threonine kinase catalytic domain. (B), (D), (F), (H), (J) TAILS 3, 5, 6 7 and 8 were localized to the rhoptries and (C), (E), (G), (I) (K) showed impaired processing upon ASP3 depletion. Arrowheads represent pro and mature forms of the proteins. MIC6 was used as control. (L, M) Altered localization of TAILS3 and TAILS8 in the rhoptries upon ASP3 depletion.


