(
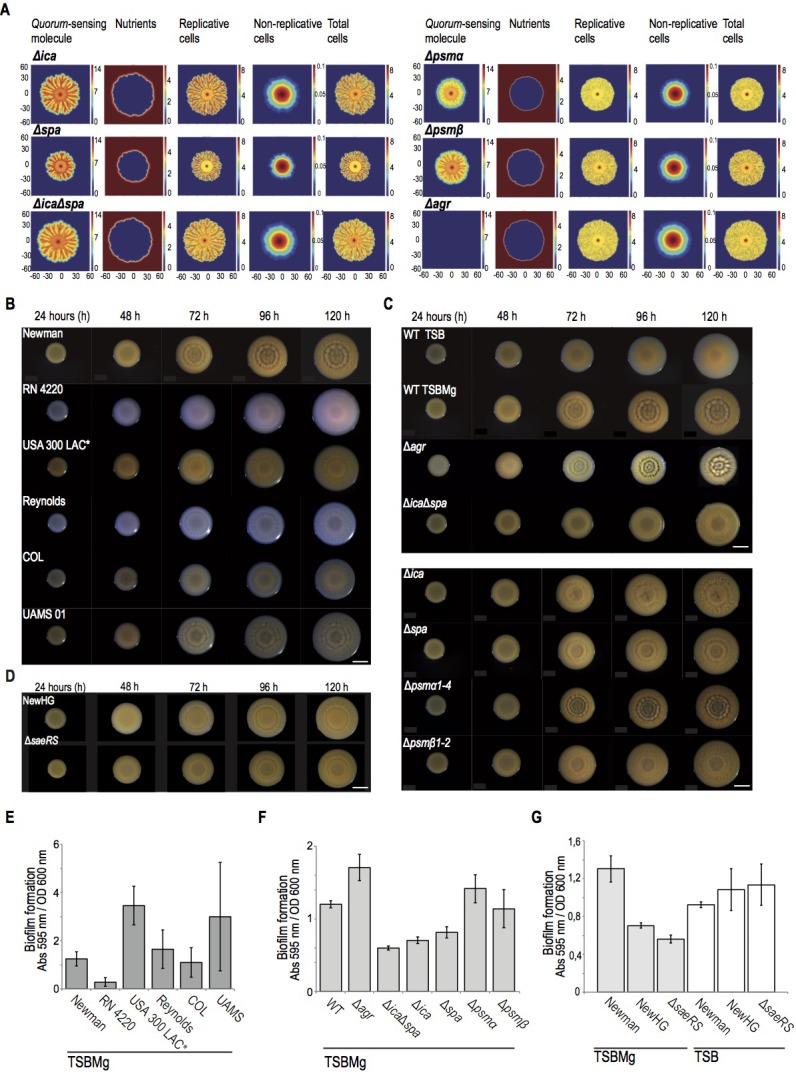
A) Local concentration of AIP and nutrients control the spatial distribution of replicative and the non-replicative cells in multicellular aggregates of
S. aureus. Mathematical modeling of
S. aureus growth in different genetic backgrounds, in 5 day-old multicellular aggregates. Each one of the rows represented the genetic backgrounds that have been modeled. The different properties of the microbial community that are quantified are represented in columns and their concentration is shown in a color scale. The mathematical model predicts that the extracellular matrix of the multicellular aggregate prevents the diffusion of AIP (first left column). Therefore, higher concentrations of AIP will be found in the centered older regions of the aggregate. Consequently, this mathematical model shows that the diffusion of the AIP is more efficient in matrix-deficient mutants, such as Δ
ica, Δ
spa and Δ
icaΔ
spa mutants. Moreover, the mathematical model predicts that, as an aggregate grows and expands through the surface of the agar, the nutrients exhaust in the centered older region (second left column). Therefore, this centered region of the aggregate contained higher concentration of non-actively dividing cells (second right column). Because this centered older region is particularly enriched in AIP concentration, it also contains a higher representation of specialized DRcells. Moving towards the aggregate’s edge increases nutrient availability and cells divide actively (first and second right columns). This generates newer regions with lower concentrations of AIP (first left column), which are enriched in BRcells. (
B) Top-view pictures showing the development of microbial communities of different clinical isolates and laboratory strains of
Staphylococcus aureus when they grow in TSBMg (
Koch et al., 2014). Scale bar = 5 mm. (
C) Top-view pictures showing the development of microbial communities of different genetic backgrounds of
S. aureus strain Newman when they grow in TSBMg. Scale bar = 5 mm. (
D) Top-view pictures showing the development of microbial communities of Newman derivative strains. Among all the clinical isolates initially tested, we deliberately selected the classical model strain Newman to perform further experiments. However, this strain has been catalogued as poor biofilm former using the classical pellicle formation assay in liquid TSB (
Cue et al., 2015). In contrast, the strain Newman develops robust multicellular aggregates in TSBMg plates and robust biofilms in liquid TSBMg. Since the Newman strain was originally isolated from a long-term bone-associated infection that usually involves biofilm formation (
Duthie and Lorenz, 1952) and bones are important reservoir of Mg
2+ in the body (
Günther, 2011;
Jahnen-Dechent and Ketteler, 2012), possibly Newman strain naturally develops strong biofilms in Mg
2+-enriched growing conditions that could resemble the colonizing niches in which Newman develops biofilm-associated infections. It is important to remark that the features of organisms are the result of environmental conditions as well as genes (
Darwin, 1859). Therefore, it is perhaps most accurate to describe a phenotype as a product of the interaction between a set of genes and an environment (
Moxon et al., 1994). The reduced ability of the Newman strain to form biofilms in TSB medium has been attributed to a point mutation in the SaeS histidine kinase, which generates a constitutively active SaeS that activates the
sae regulon, which includes inhibition of biofilm formation (
Cue et al., 2015). Thus replacement of the Newman SaeS with a wild type copy of SaeS (NewHG strain) or deletion of saeRS (Δ
saeRS) restored biofilm formation (
Cue et al., 2015). However, it is possible that the point mutation in SaeS in Newman strain occurred to naturally develop strong biofilms in Mg
2+-enriched growing conditions because Newman strain is a robust biofilm former in TSBMg. We tested the capacity of the NewHG and Δ
sae strains to form multicellular aggregates in TSBMg medium and, in contrast to Newman strain, the NewHG strain showed limited capacity to form aggregates in TSBMg. Moreover, the Δ
sae strain showed almost totally impaired to develop aggregates in TSBMg. These results are consistent with the hypothesis that a constitutively active SaeS facilitates biofilm formation of Newman strain in Mg
2+-enriched colonization niches. (
E) Quantification of biofilm formation of the different strains of
S. aureus when they grow in liquid TSBMg medium using the traditional assay of biofilm formation in 24-well titer plates (
O'Toole and Kolter, 1998a). (
F) Quantification of biofilm formation of different genetic backgrounds of
S. aureus strain Newman when they grow in liquid TSBMg medium in 24-well titer plates. There is a strong correlation between the architectural complexity of the multicellular aggregate (see panels A and B) and the ability of the strain to form biofilm in the classical biofilm formation assay that entitles forming submerged pellicles in the bottom of a well that contains liquid medium (
O'Toole and Kolter, 1998a). (
G) Quantification of biofilm formation of Newman and derivative NewHG and Δ
saeRS strains when they grow in liquid TSBMg and TSB in 24-well titer plates. The strains showed different biofilm behavior in TSBMg and TSB media. The capacity to form biofilm in TSB medium directly correlates to
sae expression levels. However, in TSBMg, biofilm formation indirectly correlates to
sae expression.


