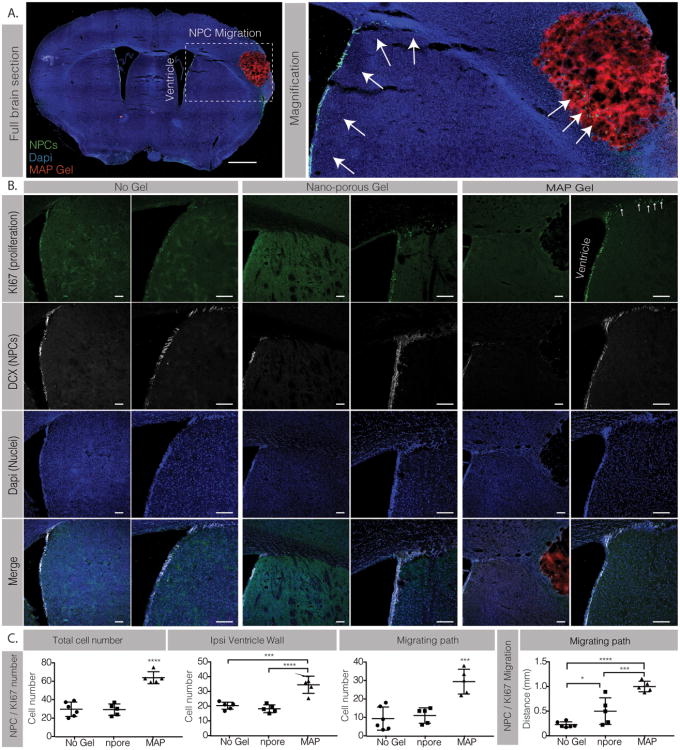
Figure 2.
A. Full section fluorescent image and magnification showing DCX positively labeled NPCs (green) migrating from the ipsilateral ventricle to the stroke area (scale 0.5mm). B. Co-staining of Ki67 (green) and DCX positive NPCs (white) (scale 100μm). C. Analysis of KI67 / DCX total cell number and migrating distance. *, *** and **** indicate P < 0.05, P < 0.001 and P < 0.0001, respectively (Anova 1 way, Tukey's opst-hoc test).

