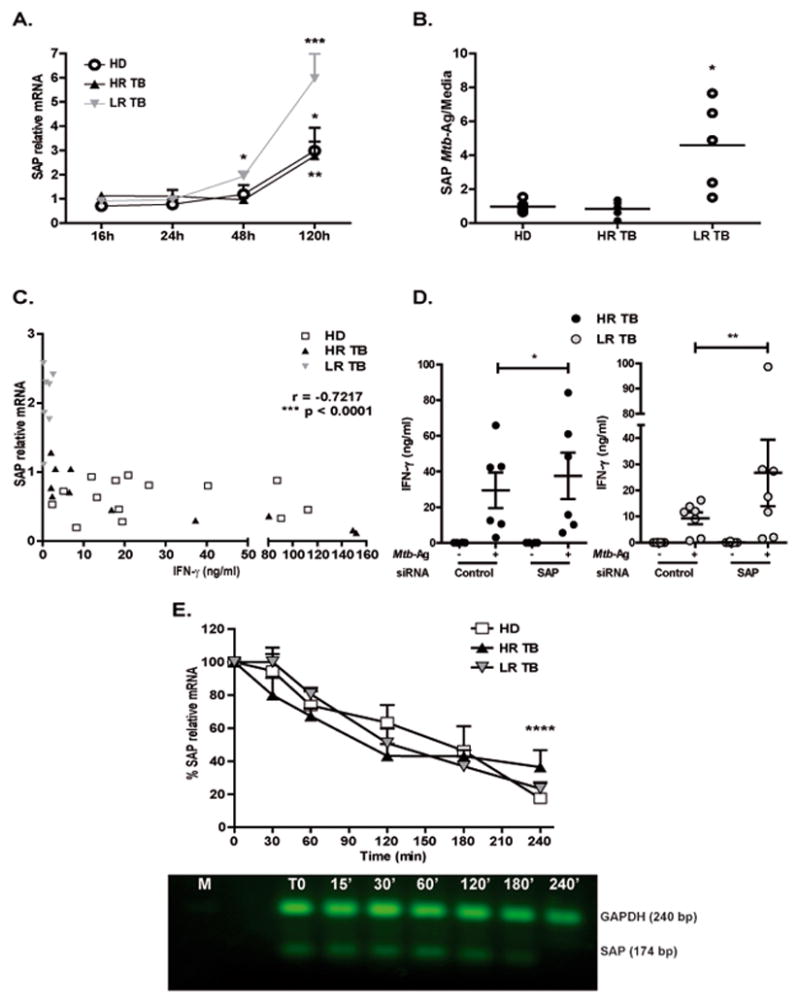
Figure 2. SAP mRNA and protein levels are increased in patients with low IFN-γ production.

(A) PBMCs from Healthy Donors (HD, N=10), High Responder Tuberculosis patients (HR TB, N=8) and Low Responder Tuberculosis patients (LR TB, N=6) were stimulated with Mtb-Ag for different times. SAP mRNA expression was determined by Real time PCR. Values were calculated as fold of increase using the comparative method for relative quantification after normalization to GAPDH expression. Fold increase = 2(−ΔΔCt), where ΔCt = [Ct (SAP) – Ct (GAPDH)] and ΔΔCt [ΔCt Mtb − ΔCt Media]. Bars represent the mean ± SEM. (B) Total cell protein extracts were prepared from PBMCs stimulated with Mtb-Ag for 5 days and SAP protein expression were then measured by Western Blot. (C) Correlation between IFN-γ production and SAP mRNA expression. PBMCs from HD (N=16), HR TB (N=11) and LR TB (N=7) patients were stimulated for 48h with Mtb-Ag. Cell-free supernatants were then collected and assayed for IFN-γ by ELISA (X axis). SAP mRNA expression was determined by Real time PCR (Y axis). (D) PBMCs from HR TB (N=6, black circles) and LR TB (N=7, grey circles) patients were incubated in presence of SAP siRNA or unspecific control (GFP) for 48h. After 5 days of Mtb-Ag stimulation, cell-free supernatants were collected and assayed for IFN-γ by ELISA. Bars represent the mean ± SEM. (E) PBMCs from HD (N=5), HR (N=5) and LR (N=4) tuberculosis patients were stimulated with Mtb-Ag for 48 hours. Actinomycin D (actD) was added and cells were collected at different time points. SAP mRNA levels were determined by Real Time PCR. Values are expressed as the mean ± SEM of the Fold increase relative to time zero, as follows Fold increase = 2(−ΔΔCt), where ΔCt = [Ct (SAP) – Ct (GAPDH)] and ΔΔCt [ΔCt Mtb with actD − ΔCt Mtb without actD]. The image shows cropped gel corresponding to GAPDH and SAP mRNA decay. ****p <0.0001 Differences between time zero vs. Mtb with ActD at 240’ for each group of individuals. (A, B, D, E) One way ANOVA-Uncorrected Fisher’s LSD. *p <0.05, **p <0.01, ****p <0.0001. (C) Correlation factor (r) and p value were calculated by the non-parametric Spearman correlation test.
