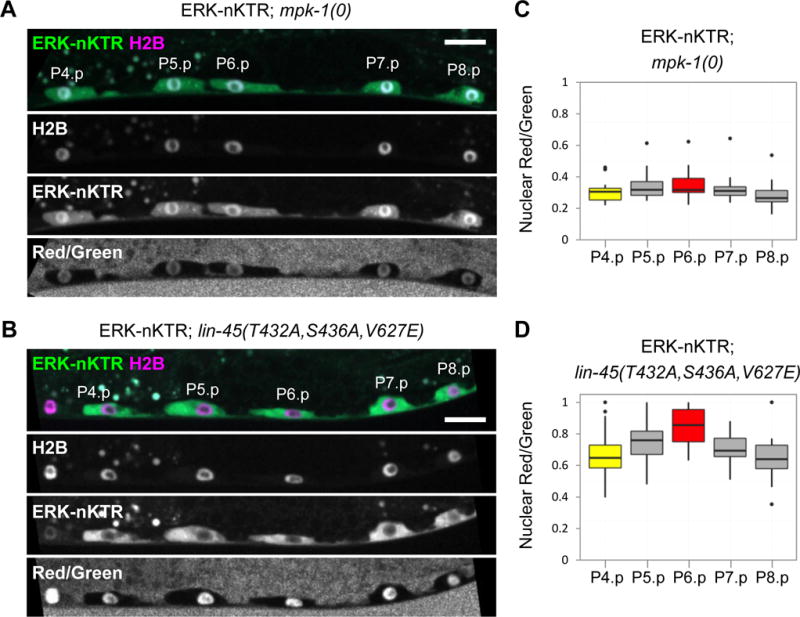
Figure 3. The ERK-nKTR is sensitive to levels of MPK-1/ERK activity.

Images of ERK-nKTR transgene arTi85 in genetic backgrounds with altered MPK-1/ERK activity show ERK-nKTR-mClover (ERK-nKTR), mCherry-H2B (H2B), and the calculated Red/Green ratio (Red/Green). (A) Loss of MPK-1/ERK activity in mpk-1(0) causes nuclear accumulation of ERK-nKTR in P6.p, similar to the pattern seen with the non-phosphorylatable ERK-nKTR(AAA) (see Fig. 2D). (B) Ectopic activation of MPK-1 in all VPCs, achieved by expression of a constitutively active and stable form of LIN-45/Raf (see STAR Methods), results in ectopic exclusion of ERK-nKTR from the nuclei of P4.p, P5.p, P7.p, and P8.p, similar to the result seen with the phospho-mimetic ERK-KTR(EEE) (see Fig. 2E). (C–D) Red/Green ratios for VPC nuclei expressing ERK-nKTR in (C) mpk-1(0) (n=19), or in (D) the presence of hyperactive LIN-45/Raf (n=16).
To assess whether the localization of ERK-nKTR is patterned in VPCs of each genotype, one-way ANOVAs were performed to compare the Red/Green ratios in all VPCs. ERK-nKTR is not patterned in mpk-1(0); there are not significant differences in Red/Green ratios between VPCs (at the p<0.01 level, F(4,90)=1.66, p-value=0.165). However, in the presence of hyperactive LIN-45/Raf, there is a significant effect on Red/Green ratios when different VPCs are compared (at the p<0.01 level, F(4,79)=4.52, p-value=0.002). In this case, post hoc pairwise comparisons indicate that the Red/Green ratio of P6.p is significantly different from those of P8.p (p-value<0.01) and P4.p (p-value<0.05) (see statistical tests in Supplemental Materials).
