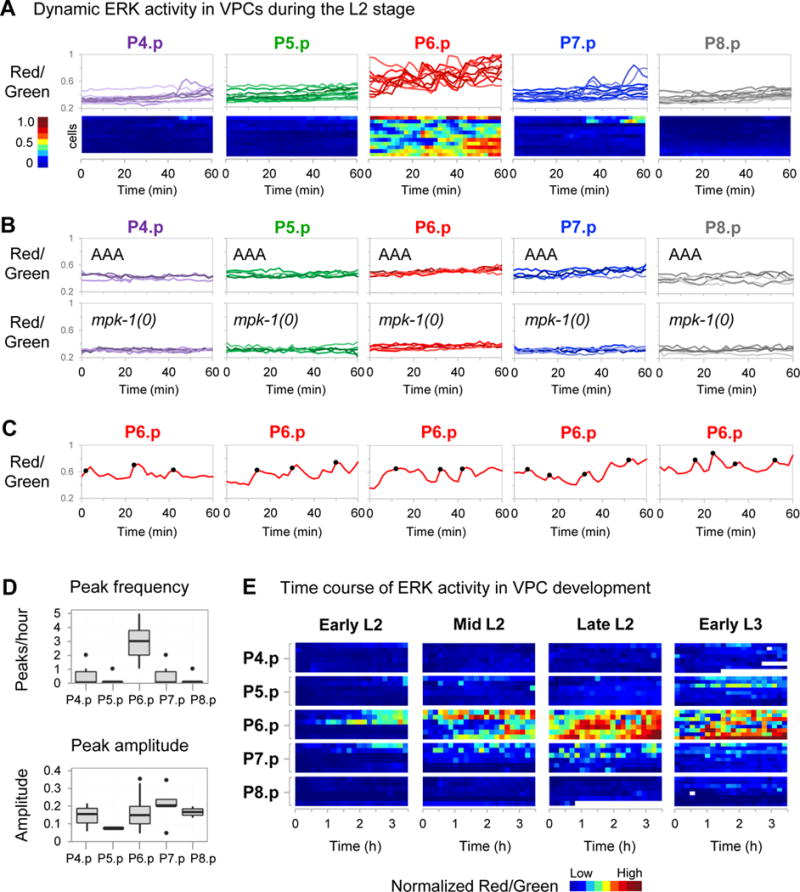
Figure 5. Live imaging of ERK-nKTR during VPC development.

Unless otherwise indicated, movies were made of strains containing the transgene arTi85, which expresses ERK-nKTR in VPCs. (A) To examine ERK activity dynamics in wild-type late L2 larvae, time-lapse movies were captured by imaging at 2 minute intervals over a 1 hour time period (see STAR Methods). The Red/Green ratio of individual VPC nuclei over time is shown in two ways: all individual traces overlaid for each VPC (top), and a heatmap (bottom) where each row represents a cell, and Red/Green ratio is represented by color (n=11 larvae). (B) Time-lapse movies were captured as described in (A) to examine arTi101 larvae that express non-phosphorylatable ERK-nKTR(AAA) in an otherwise wild-type background (top, n=5 larvae), and mpk-1(0) larvae that express ERK-nKTR (bottom, n=5 larvae). Shown are all individual traces overlaid for each VPC. (C) Time-lapse Red/Green data for all individual nuclei were analyzed for peaks (STAR Methods). Shown are five representative traces for P6.p cells, where Red/Green of individual nuclei is shown over time, and the position of activity peaks are indicated by black circles. (D) Peak frequency (peaks/hour) is shown for each VPC (top). A two-sample k-test was performed to make pairwise comparisons of peak number (per hour) between VPCs. The peak frequency found in P6.p differed significantly from peak frequency in all other VPCs (p-value<1×10⁻⁶). The relative peak amplitude (difference between Red/Green ratio at peak and nearest trough) is shown for each VPC (bottom). No significant differences in relative peak amplitude were found in pairwise comparisons of different VPCs using a two-sample k-test. (E) Time-lapse movies were captured by imaging at 10 minute intervals over 4 overlapping 3.5-hour time periods after egg lay to examine ERK activity in wild-type VPC development: 20–23.5 hours (Early L2), 23–26.5 hours (Mid L2), 26–29.5 hours (Late L2), and 30–33.5 hours (Early L3) (see also STAR Methods, Fig. S3A). Heat maps where each row represents a cell, and Red/Green ratio of nuclei is represented by color. To correct for variation between animals, the average Red/Green value for the P4.p nucleus of a given larva was used as an internal baseline for normalization of other VPCs in that individual, since P4.p experiences minimal EGF signal (see Discussion and STAR Methods). Occasional missing values in heatmaps (white) result when the nucleus is out of focus for the time point.
