Figure 2.

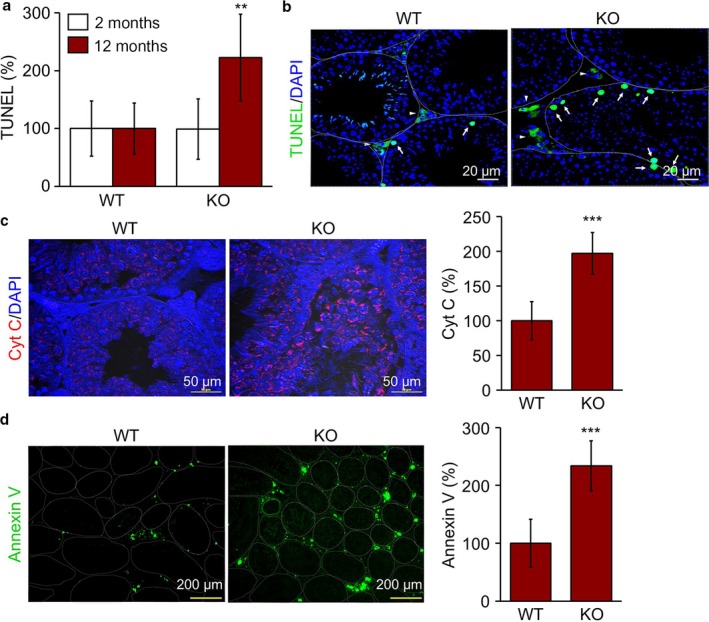
Increased apoptosis in TAZ KO testicles. Testis tissue sections (n = 6 per group) obtained from 2‐ and 12‐month‐old WT and KO mice were analyzed by immunohistochemistry. (a) TUNEL‐positive cells were counted at 10 different images of each mouse testis and expressed as a percentage of WT value. (b) Representative images of TUNEL‐positive cells (green). (c) Immunohistochemistry with antibody against cytochrome C (red) and quantitative analysis of Cyt C‐positive cells by ImageJ program. Nuclei were counterstained with DAPI (blue) in b and c. (d) Representative images of Annexin V staining and quantitative analysis of Annexin V‐expressing cells (green). The data are expressed as the mean ± SD of 10 different regions from six different samples. **P < 0.005, ***P < 0.0005.
