Figure 3.

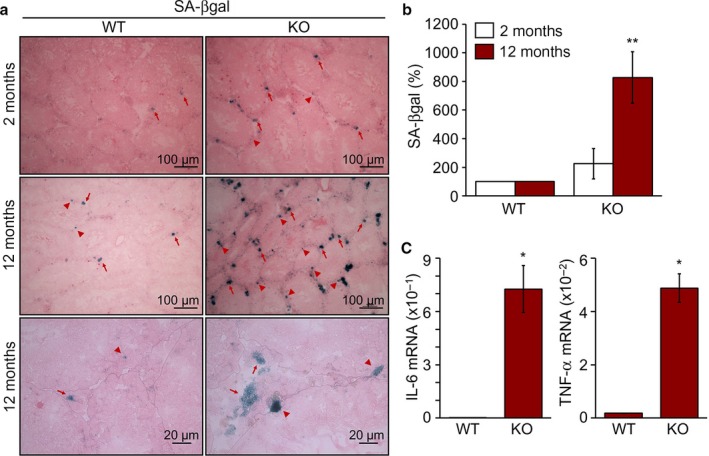
Enhanced senescence phenotypes by TAZ deficiency. (a) SA‐βgal staining of frozen testis sections of 2‐ and 12‐month‐old WT and KO mice (n = 6/group), followed by observation with a microscope. Arrows and arrowheads indicate SA‐βgal‐positive spermatogonial and Leydig cells, respectively. (b) Quantitative analysis of SA‐βgal expression in WT and KO. **P < 0.005. (c) Total RNA was extracted from the testis of WT and KO mice (12 months old, n = 6). Relative transcript level of IL‐6 and TNF‐α determined by a quantitative real‐time PCR analysis. *P < 0.05.
