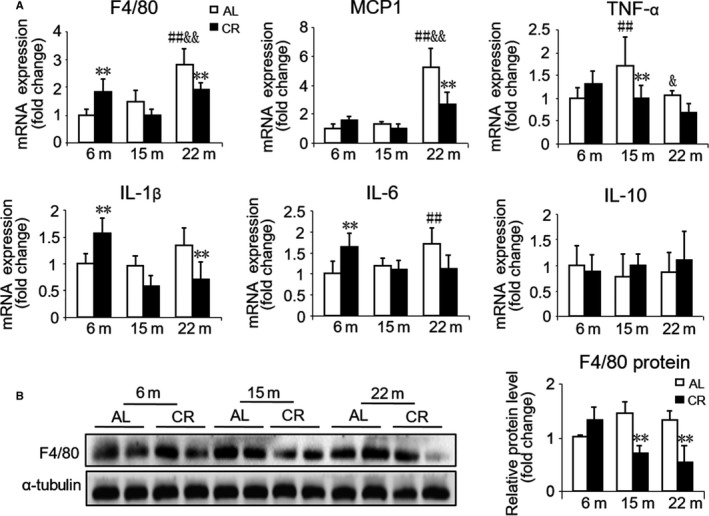
Figure 3.

Effect of age and CR on cardiac inflammation. (A) mRNA quantification of the inflammation genes. (B) Representative Western blots (left) and densitometric analysis (right) of the specific macrophage marker F4/80 and α‐tubulin (loading control). Mean ± SEM, n = 4 for Western blots. *P < 0.05 vs. age‐matched AL group, **P < 0.01 vs. age‐matched AL group. #P < 0.05 vs. 6 months AL group, ##P < 0.01 vs. 6 months AL group. &P < 0.05 vs. 15 months AL group, &&P < 0.01 vs. 15 months AL group.
