
Figure 4.
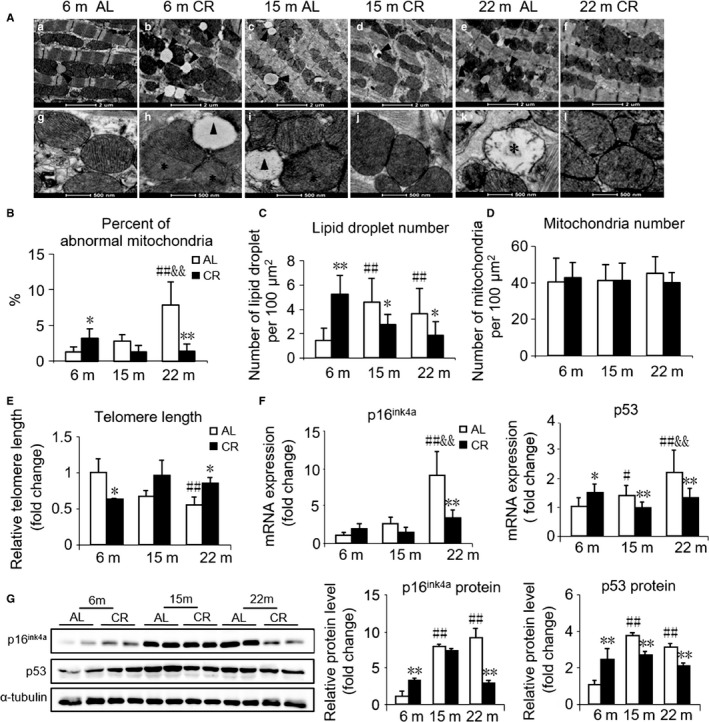
Effect of age and CR on cardiac mitochondrial structure, telomere length, and senescence markers. (A) Representative images of mitochondria in cardiac muscle from AL and CR mice at 6, 15, and 22 months of age using transmission electron microscopy. ‘*’ shows damaged mitochondria (mitochondria with reduced numbers of cristae and matrix density). ‘▲’ is labeling lipid droplets. a–f, scale bars, 2 μm. g–l, scale bars, 500 nm. (B) Quantitative morphometric analyses of cardiac mitochondrial ultrastructural abnormalities. (C) Quantification of lipid droplet number. (D) Quantification of mitochondrial number. (E) Telomere lengths of cardiac tissues from AL and CR mice at 6, 15, and 22 months of age by RT‐qPCR. (F) mRNA quantification of the senescence marker genes. (G) Representative Western blots (left) and densitometric analysis (right) of senescence markers p16ink4a, p53, and α‐tubulin (loading control). Mean ± SEM, n = 20 sections for the quantitative morphometric analysis, n = 10 for telomere length analysis, n = 4 for Western blots. *P < 0.05 vs. age‐matched AL group, **P < 0.01 vs. age‐matched AL group. #P < 0.05 vs. 6 months AL group, ##P < 0.01 vs. 6 months AL group. &P < 0.05 vs. 15 months AL group, &&P < 0.01 vs. 15 months AL group.