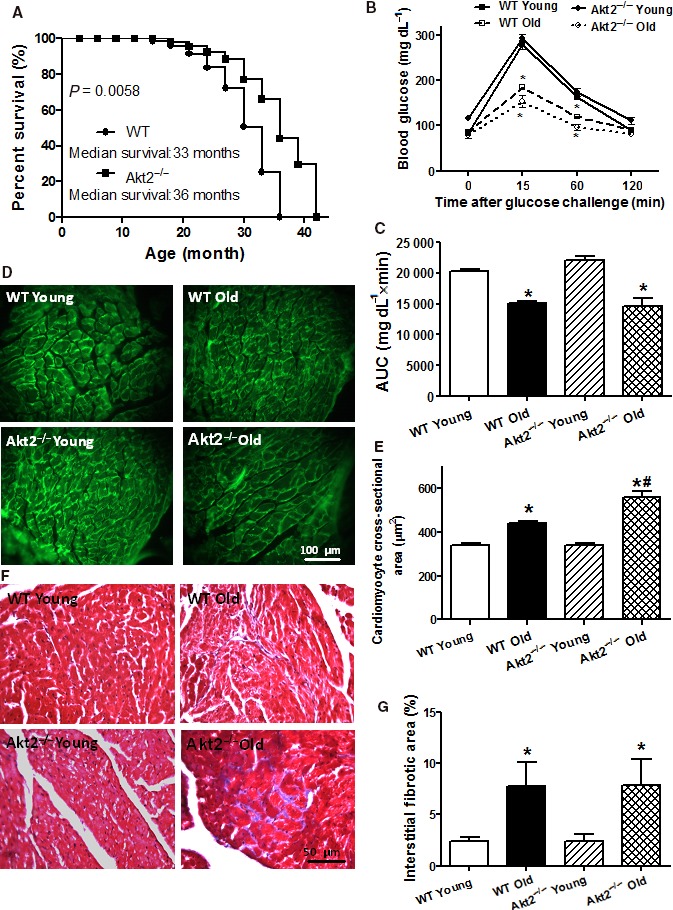
Figure 1.

Cumulative survival curve, intraperitoneal glucose tolerance test (IPGTT, 2 g kg−1), area underneath curve (AUC), and myocardial morphology in male WT and Akt2 knockout (Akt2−/−) mice at young (3–4 months) and old (24–26 months) ages. (A) Kaplan–Meier cumulative survival rate plotted against age in months in WT and Akt2−/− mice. The log‐rank test was performed to compare the two curves (P = 0.0058). (B) Plasma glucose levels within 120 min following IPGTT challenge; (C) AUC; (D) Representative FITC‐conjugated lectin staining depicting the transverse sections of left ventricular myocardium (×400); (E) Quantitative analysis of cardiomyocyte cross‐sectional area; (F) Representative Masson trichrome staining depicting interstitial fibrosis; and (G) Quantitative analysis of fibrotic area (Masson's trichrome‐stained area in light blue color normalized to the total myocardial area). Mean ± SEM, n = 31 mice per group for panel A; 6–7 mice per group for panel B–C; 19–20 fields from five mice per group for panel D–E; and 9–10 fields from five mice per group for panel F–G, *P < 0.05 vs. respective WT young, # P < 0.05 vs. WT old group.
