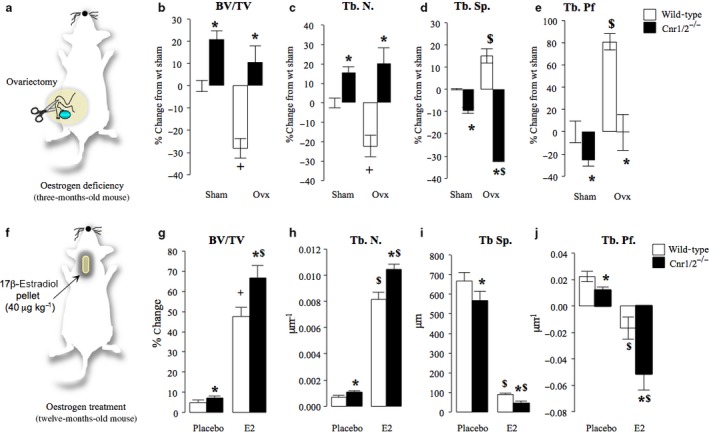
Figure 4.

Effects of oestrogen deficiency and replacement on bone mass in Cnr1/2 double‐knockout aged female mice. (a–e) Trabecular bone volume (b, BV/TV, %), number (c, Tb. N., μm−1) and separation (d, Tb.Sp., μm) and trabecular pattern factors (e, Tb.Pf, μm−1) in sham and ovariectomized 3 month Cnr1/2 double‐knockout (Cnr1/2−/−, n = 7) CD1 mice and wild‐type control (n = 6) assessed at the tibial metaphysis by microCT. (f–j) Trabecular bone parameters in 12‐month‐old Cnr1/2 double‐knockout (Cnr1/2−/−) CD1 mice and wild‐type control treated with placebo (n = 7) or estradiol (E2, 40 μg kg−1 day−1, n = 7) for 3 months and bone parameters assessed at the tibial metaphysis by microCT (a: bone volume, BV/TV (%); b: trabecular number, Tb. N. (μm−1); c: trabecular separation, Tb.Sp. (μm); d, trabecular pattern factor, Tb.Pf. (μm−1). Values are mean ± SD. *P < 0.05, wild‐type versus Cnr1/2−/− groups, $P < 0.05, wild‐type sham and ovariectomized (ovx) groups and + P < 0.05, placebo and E2 groups.
