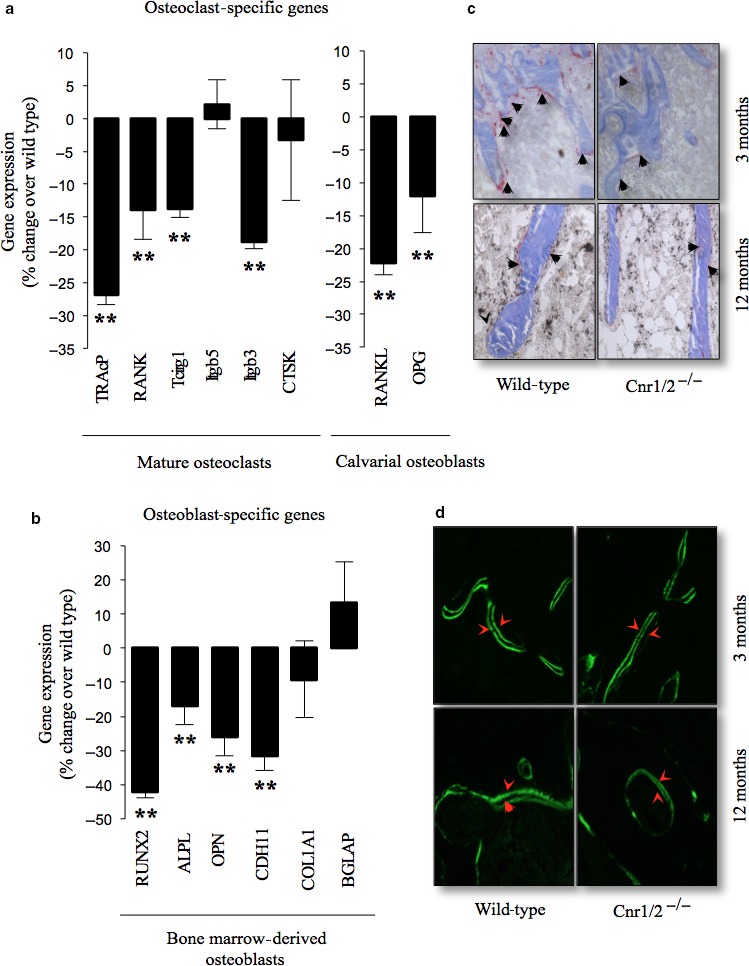
Figure 5.

Combined deficiency in Cnr1 and 2 receptors reduces the expression of osteoclast and osteoblast‐specific genes. (a – b) The expression of osteoclast (a)‐ and osteoblast (b)‐specific genes was measured by RT–PCR followed by qPCR. Transcript numbers are expressed as copy number per mg and normalized over of 18s RNA. Values in the graphs are mean ± SD and are obtained from three independent experiments (*P < 0.05, **P < 0.01, from wild‐type). RANKL‐ and M‐CSF‐generated osteoclast, bone marrow osteoblast and calvarial osteoblast cultures were obtained from three independent experiments. Abbreviations and primers are listed in Table S2. (c – d) Representative photomicrographs of trabecular bone from the tibial metaphysis of Cnr1/2 double‐knockout (Cnr1/2−/−) and wild‐type control female mice at 12 months of age showing (c) osteoclasts (tartrate‐resistant acid phosphatase [TRAcP] staining, black arrows) and (d) bone surface (double Calcein labelling, red arrows).
