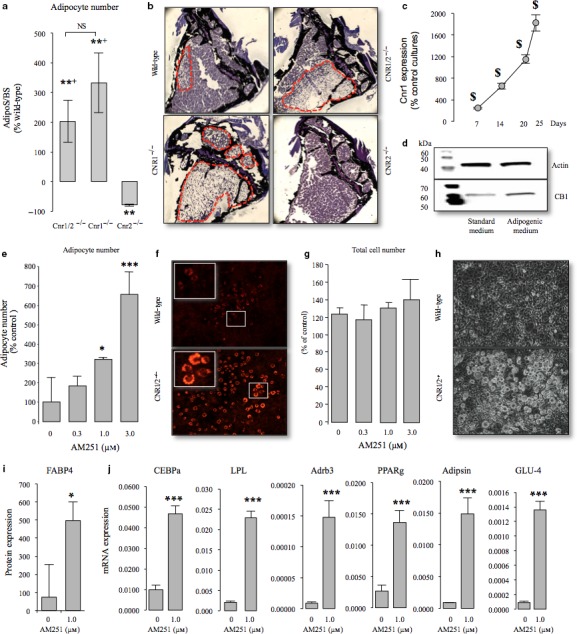
Figure 6.

Blockade of Cnr1, but not Cnr2, enhances adipocyte differentiation in vitro and in vivo. (a) Quantification of adipocyte numbers at the tibial metaphysis in mice with Cnr1, 2 or both receptor deficiencies at 12 months of age. NS, not significantly different from Cnr2; *P < 0.05 from wild‐type; + P < 0.05 from Cnr2. (b) Representative photomicrographs of bone from panel a showing bone (Von Kossa staining, black) and bone marrow adipocyte (dotted line). (c – d) Western blot analysis of the Cnr1 receptor in the preadipocyte 3T3‐L1 cells cultured in standard or adipogenic medium for the indicated period. $ P < 0.05 from standard medium treated cultures (e – h) Quantification of adipocyte numbers by staining with Nile Red (e) and viability by AlamarBlue assay (g) in cultures of the preadipocyte 3T3‐L1 cells treated with vehicle (0.1% DMSO) or the CB1‐selective inverse agonist AM251 in the presence of insulin (1 μg mL−1) for 10 days. (f and h) Representative photomicrographs of adipocytes in the presence (f) or absence (h) of Nile Red staining (X10 magnification). (i) The protein level of FABP4 in the 3T3‐L1 cells described in panels e – h as assessed by Western blot analysis, (i) The mRNA expression of the adipocyte‐specific genes CCAAT/enhancer binding protein alpha (CEBPα); lipoprotein lipase (LPL); adrenoceptor beta 3 (Adrb3); peroxisome proliferator‐activated receptor gamma (PPARγ); Adipsin (complement factor D, CFD) or beta‐glucosidase 4 (GLU4) in the 3T3‐L1 cells described in panels e – i as assessed by RT–PCR followed by qPCR, (j) in the 3T3‐L1 cells described in panels e – h as assessed by Western blot analysis and qPCR, respectively. *P < 0.05 and ***P < 0.001 from vehicle treated. Transcript numbers are expressed as copy number per mg of 18s RNA. Data are from three independent experiments (n = 3). Abbreviations and primers are listed in Table S2.
