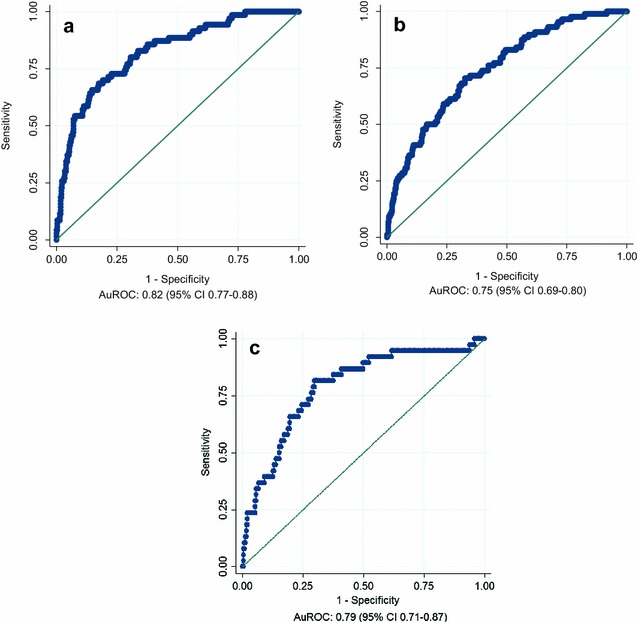
Fig. 2.

Receiver operating characteristics (ROC) curve obtained when applying the 28 day prognostic model to the derivation (a), geographic validation (b) and temporal validation sub-cohorts (c) respectively; AuROC area under the receiver operating characteristic curve, CI confidence interval
