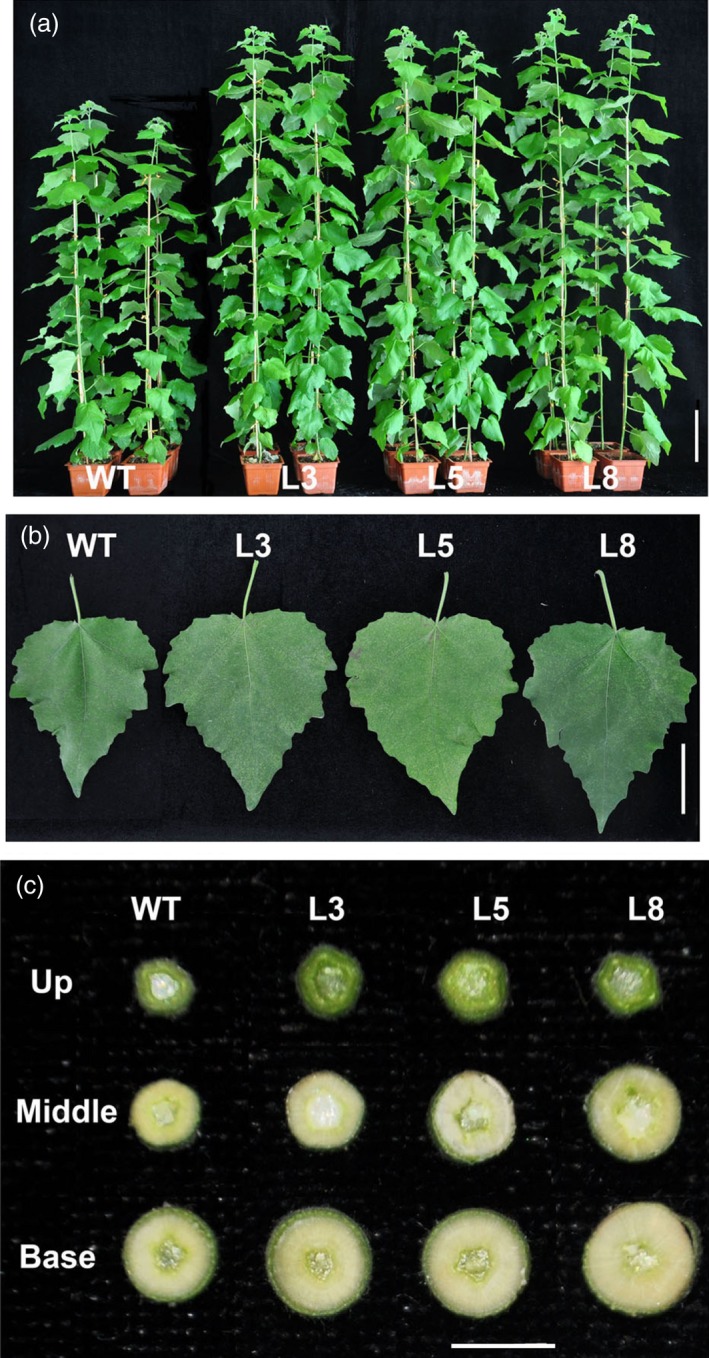
Figure 5.

Growth comparisons of wild‐type and PtCYP85A3 transgenic plants. (a) Phenotype of 3‐month‐old wild‐type and transgenic plants (lines 3, 5 and 8). Bar=10 cm. (b) Leaf phenotypes of 3‐month‐old wild‐type and transgenic plants (lines 3, 5 and 8). Bar=5 cm. (c) The cross sections of the stems from different parts of 3‐month‐old wild‐type and transgenic plants (lines 3, 5 and 8). Bar = 5 mm.
