
Figure 2.
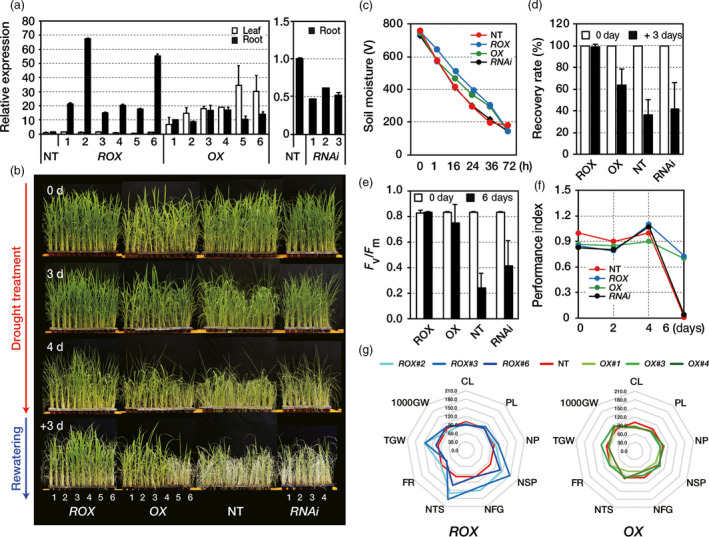
Drought tolerance of OsERF48 overexpressing plants. (a) Relative expression of OsERF48 transcripts in transgenic and nontransgenic (NT) plants. Two‐week‐old roots or leaves from transgenic plants were used for the analysis. OsUbi1 expression was used as an internal control. Values are the means ± SD of three independent experiments. (b–d) All plants were grown in soil for 1 month under well‐watered conditions and were then exposed to drought stress for 4 days, followed by re‐watering for 3 days in the greenhouse. (b) Drought tolerance of transgenic and NT plants. (c) Soil moisture in the pots exposed to drought treatment at the indicated time points. Values are the means ± SD (n = 20). (d) Recovery rate scored 7 days after re‐watering. Values are the means ± SD (n = 30). (e, f) Determination of the photosynthetic viability of transgenic and NT plants under drought conditions. All plants were grown in soil for 2 months under well‐watered conditions and then exposed to drought stress for 6 days. At the indicated time point after exposure to drought stress, the chlorophyll fluorescence (F v /F m ) (e) and performance index (f) of transgenic and NT plants were measured. Each data point represents the mean ± SD (n = 30 points per independent lines of each genotypes). (g) Agronomic traits of transgenic and NT plants under drought conditions. The spider plot represents the agronomic traits by the percentage of the mean values (n = 18), listed in Table 1. Mean measurements from the NT control were assigned a 100% reference value. CL, culm length; PL, panicle length; NP, number of panicle; NSP, number of spikelet per panicle; NFG, number of filled grain; NTS, number of total spikelet; FR, filling rate; TGW, total grain weight; 1000GW, 1000 grain weight. ROX , ROX O s ERF 48 ; OX , OX O s ERF 48 .