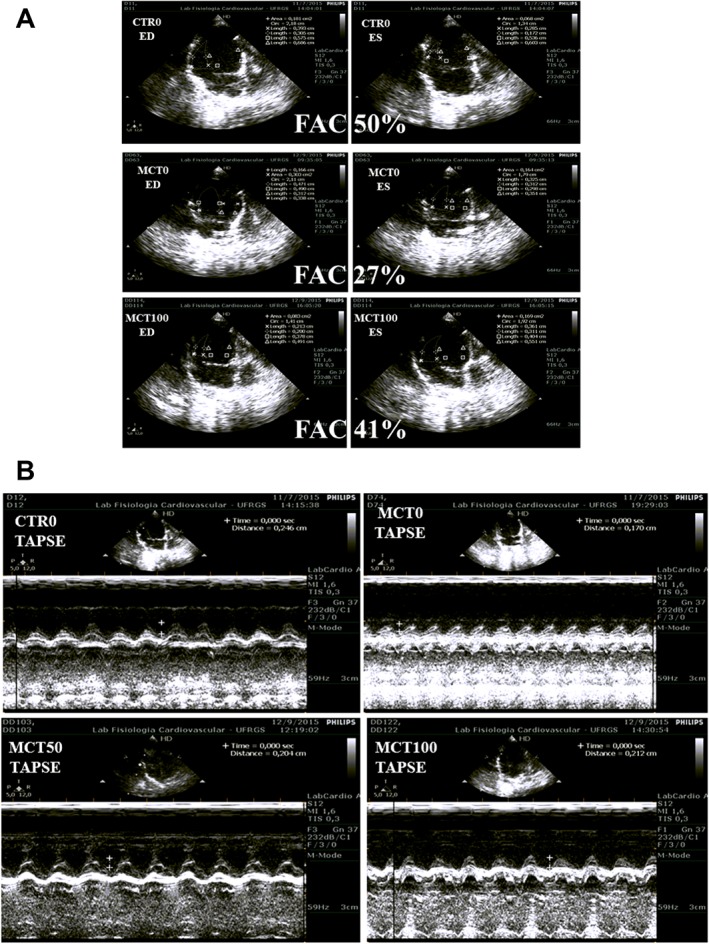
Figure 2.

Representative image of echocardiographic data in the RV of control and MCT‐treated rats. (A) FAC is used to demonstrate changes in the FAC of the control, MCT0 and MCT100 groups. (B) The TAPSE is marked for the groups CTR0, MCT0, MCT50 and MCT100. The endocardial border is traced in apical four‐chamber views from the tricuspid annulus along the free wall to the apex, then back to the annulus, along the interventricular septum at end diastole (ED) and end systole (ES). RV FAC 50%: normal subject; (middle) moderately dilated RV, RV FAC 40%: (middle) moderately dilated; and RV FAC 21%: markedly dilated.
