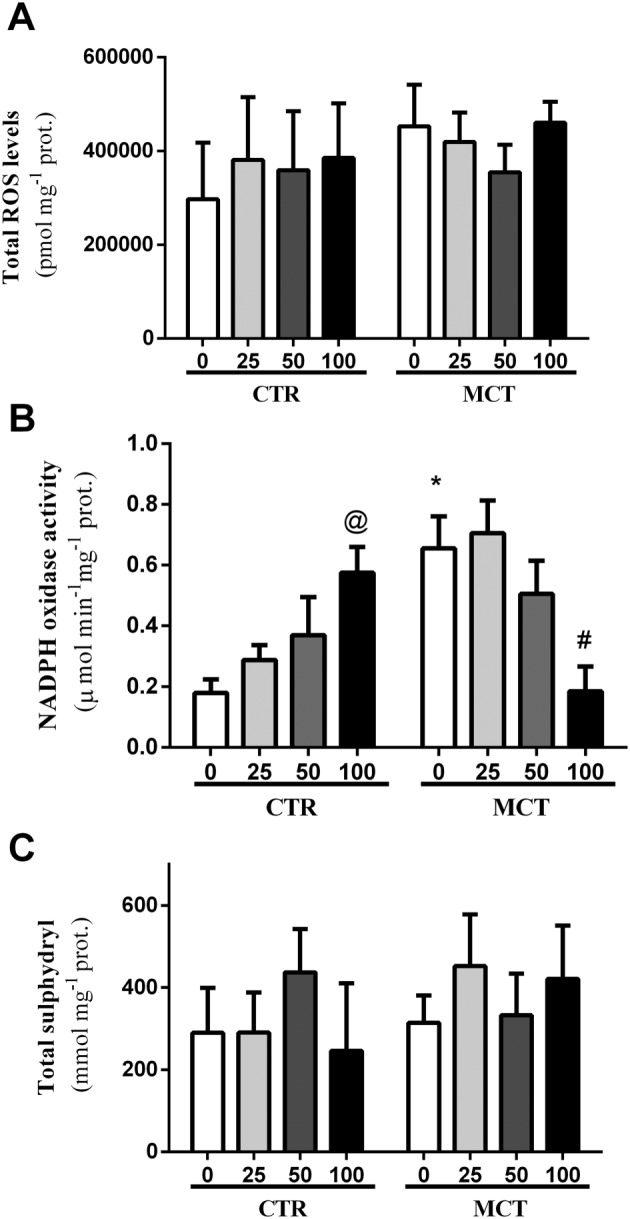
Figure 3.

Effect of p.o. administration of PTS : HPβCD complex at different doses (25, 50 and 100 mg·kg−1) on oxidative parameters. Total ROS levels (A), NADPH oxidase activity (B) and total sulphydryl content (C) in the RV of control (CTR0 and CTR25: CTR50 and CTR100) and MCT (MCT0, MCT25, MCT50 and MCT100) rats treated via gavage for 14 days. Values are expressed as mean ± SD, n = 8 per group; two‐way ANOVA with Tukey's post hoc test was performed. * Significantly different compared with CTR0; # significantly different compared with MCT0; and @ different compared with CTR.
