
Figure 4.
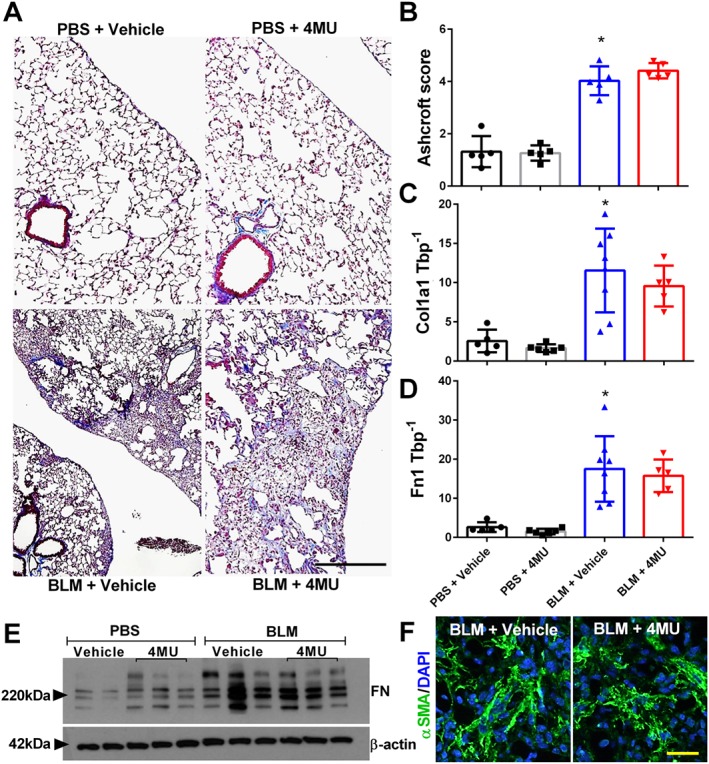
Fibrotic deposition is maintained in 4MU‐treated mice. Masson's trichome (A); Ashcroft scores (B); transcript levels for Col1a1 (C) and Fn1 (D); and immunoblots for FN and β‐actin (E) from PBS + vehicle, PBS + 4MU, bleomycin (BLM) + vehicle and BLM + 4MU treatment groups. Lung sections IF stained for αSMA (green signals) and counterstained with DAPI (blue signals) (F) from BLM + vehicle or BLM + 4MU treatment groups. Data are shown as scatter plot showing the mean ± SD. * P ≤ 0.05, significant difference between PBS + vehicle and BLM + vehicle treatment; ANOVA. The scale bar represents 50 μm. The N used for these studies are 5 (PBS + vehicle); 5 (PBS + 4MU); 5 (BLM + vehicle); and 5 (BLM + 4MU) for panel B and 5 (PBS + vehicle); 6 (PBS + 4MU); 8 (BLM + vehicle); and 5 (BLM + 4MU) for panels C and D. Variations in the N are due to violation of a predetermined criteria: repeatedly poor RNA quality and loss of sample (B–D).