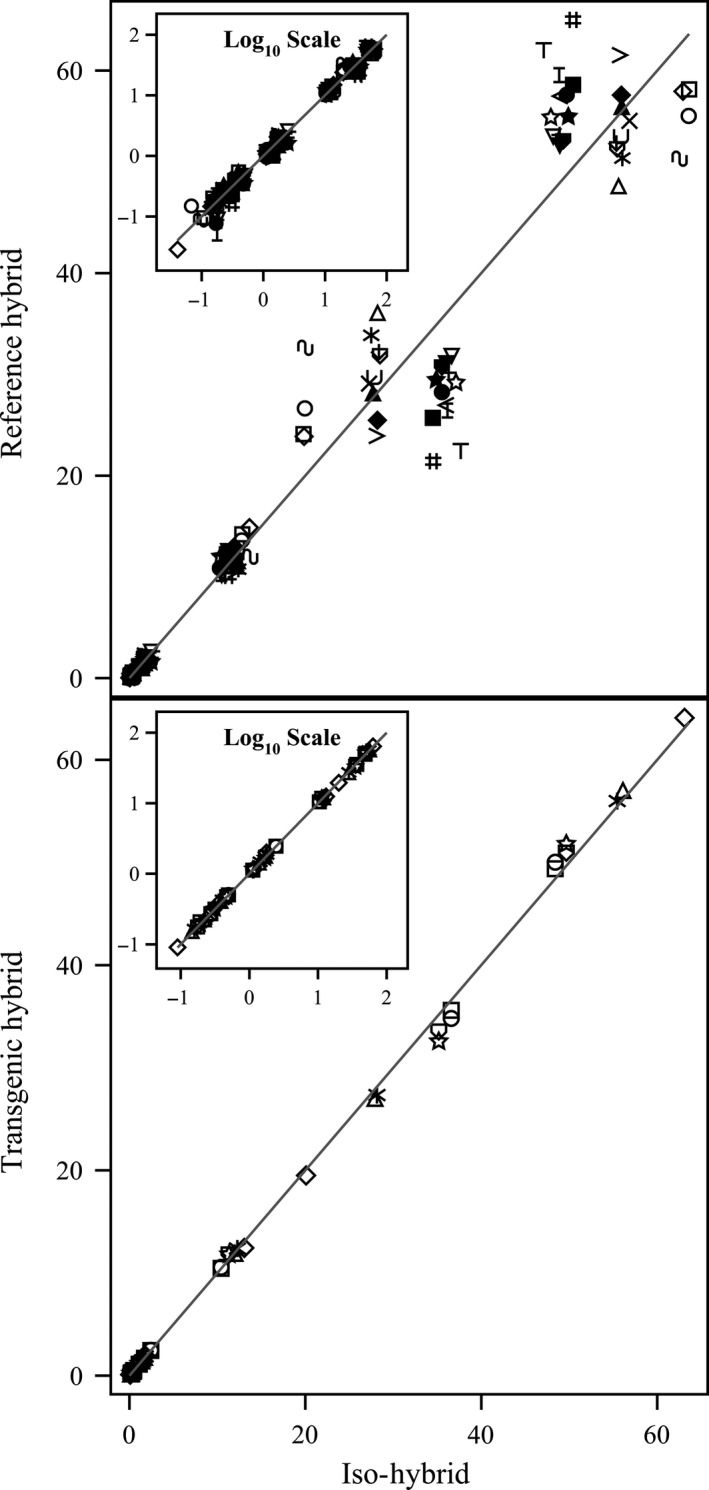
Figure 3.

Fatty acids. Scatter plot of iso‐hybrids composition vs. location‐matched reference hybrids (upper panel) and DAS‐Ø15Ø7‐1 GM breeding stacks (lower panel). Analytes from left to right: 22 : 0 behenic, 20 : 1 eicosenoic, 20 : 0 arachidic, 18 : 3 linolenic, 18 : 0 stearic, 16 : 0 palmitic, 18 : 1 oleic and 18 : 2 linoleic (% of total fatty acids). Line of identity (y = x) shown. The symbols representing each breeding stack and nonGM reference hybrid are listed in Table 1.
