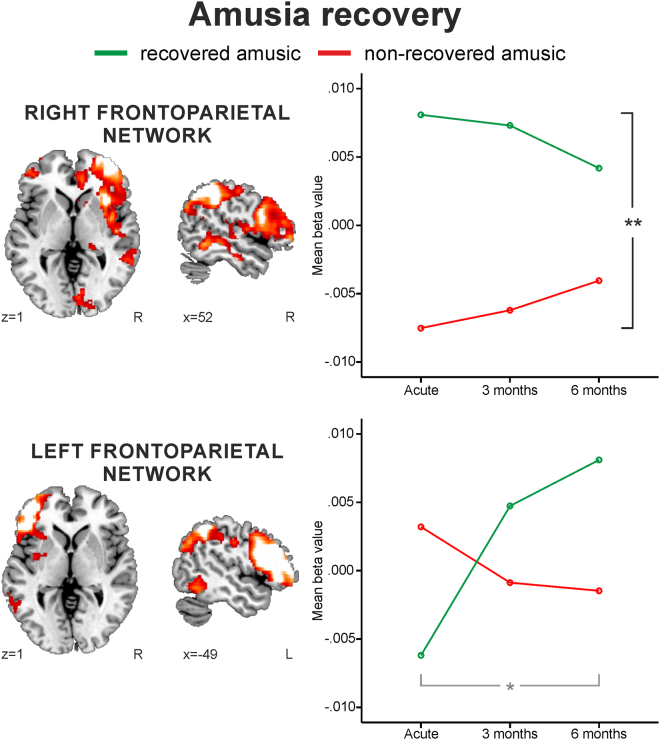
Figure 6.
Functional connectivity differences between the recovered and non-recovered amusics during the instrumental music listening. Group (RA/NRA) × Time (Acute, 3 months, 6 months) repeated measures ANOVA results. A representation of the ICA network is shown overlaid over a canonical template with MNI coordinates at the bottom right of each slice. Significant Group effect (black bar), significant Group × Time interaction (gray bar). *p < 0.05 **p < 0.001

