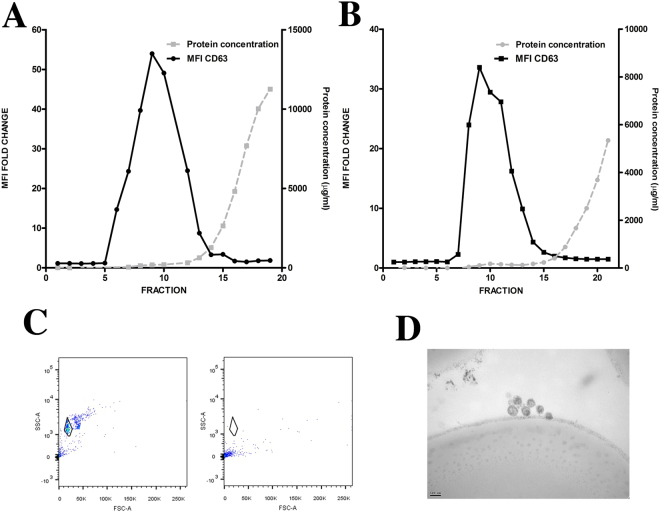
Figure 1.
SEC-elution profile of EV samples. Conditioned media from melanoma cells (A) and T-lymphoblasts (B) cultures were processed using size exclusion chromatography (SEC). The obtained fractions were analysed by flow cytometry using anti-CD63 antibody after coupling EVs with aldehyde-sulfate beads. Protein concentration was also measured by BCA assay for each fraction and plotted in the right y-axis. Fold changes of mean fluorescence intensity (MFI) relative to the isotype control are plotted in the left y-axis. (C) Beads incubated with EVs (left) or EVs in solution (right) were incubated with primary and fluorochrome-labelled secondary antibodies. The flow cytometer gate used to analyse the beads is depicted in the SSC/FCS dot-plot. (D) Those beads showing CD63 positive staining were analysed by transmission electron microscopy. Bar: 100 nm.

