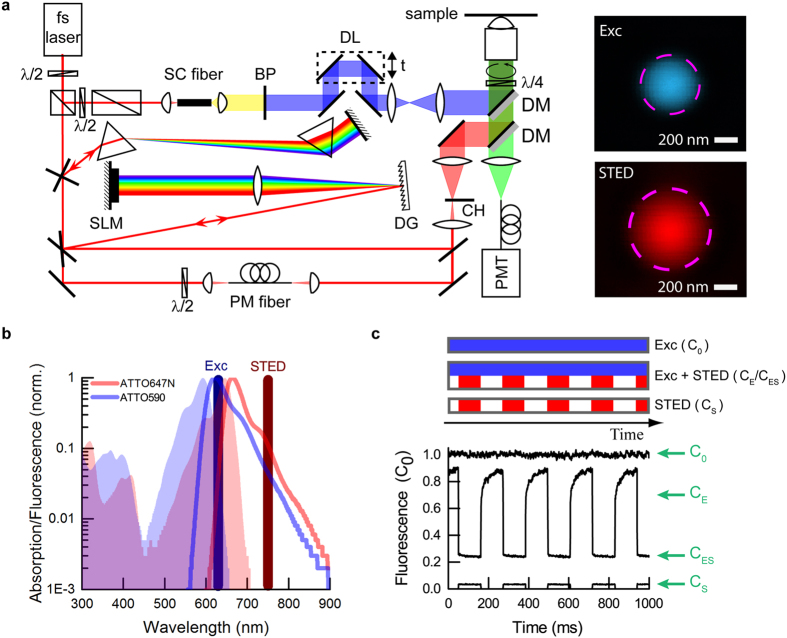
Figure 1.
Experimental setup and measurement principle to extract STED de-excitation, bleaching and STED-light-induced fluorescence. (a) Microscope with controllable fluxes of STED de-excitation photons. The laser was a femtosecond oscillator operating at 750 nm. The excitation pulse was generated in a supercontinuum (SC) fiber. The excitation wavelength was spectrally selected by the bandpass filter BP (635 nm/10 nm) and synchronized to the de-excitation pulse by the optical delay line DL. The STED pulse shape was controlled in two ways: for short pulses (0.1–3 ps), the optical path consisted of SF11 prisms as pre-compressor and a home-built pulse shaper. The pulse shaper was formed by the diffraction grating DG, the long focal-length lens and the spatial light modulator SLM placed in the Fourier plane created by those elements. For long pulses (10–500 ps, CW), the optical path consisted of polarization-maintaining (PM) fibers of various lengths. CW operation was obtained by preventing mode-locking of the Ti:sapphire laser, and an additional diode laser was used as excitation source in this case (path not shown). To register fluorescence recovery curves, the STED beam intensity was chopped. The excitation (blue) and de-excitation (red) pulses were coupled into the microscope by dichroic mirrors DM and focused into the sample by an objective lens. The fluorescence (green) was collected in back-propagation and registered by a hybrid photomultiplier PMT in a confocal arrangement, with the data acquisition synchronized to the chopper wheel (CH). The insets represent the focal spots of excitation (Exc) and STED beam, as measured by scattered signal of 80 nm gold beads. The dashed circles correspond to the FWHM of intensity. (b) Normalized spectral properties of Atto647N and Atto590, with the respective laser wavelengths for excitation and STED. The detection was centred at 690 nm and had 60 nm width (not shown). (c) Example excerpt of raw data set for a single measurement (Atto647N), with characteristic levels extracted to derive bleaching, de-excitation and STED-light-induced fluorescence. Each measurement consisted of three intensity traces (curves), registered sequentially: excitation-only, excitation with chopped STED and chopped STED only (acquisition time in each case: ~100 s). C0, CE, CES, CS denote respectively: C0 the initial signal of fluorescence (due to the excitation beam), CE the fluorescence signal right after end of exposure to the STED beam, CES the residual fluorescence signal in the presence of both the excitation and STED (de-excitation) beam, and CS the fluorescence signal caused by the STED light. Signals correspond to respective fractions of fluorophores. Excitation: ~500 fs pulse duration (FWHM), 30 μW average power; STED (shown measurement): ~25 ps pulse duration (FWHM), 50 mW average power. The delay between excitation pulse and STED pulse was ~50 ps. All powers were measured at the back aperture of the objective lens. The powers in the focal plane were ~70% of these values due to cut-off at the entrance pupil and transmission of the objective lens.

