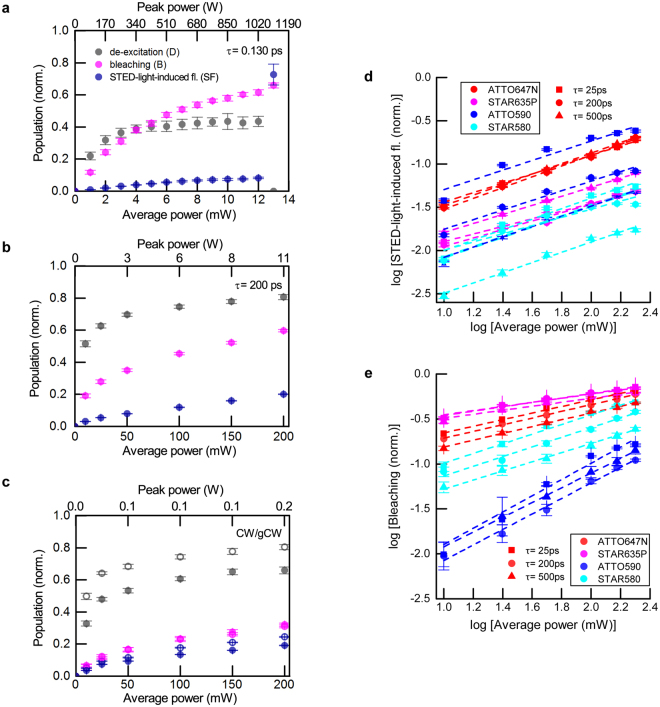
Figure 4.
Influence of STED power on de-excitation, bleaching and fluorescence induced by the STED beam. (a–c) De-excitation, bleaching and STED-light-induced fluorescence vs. time-averaged power for Gaussian STED pulses of 130 fs (a), 200 ps (b) duration, and for CW STED (c). The hollow circles in (c) indicate CW STED operation with time-gating of detected fluorescence (see text). Measurements in (a–c): ATTO647N. (d) STED-light-induced fluorescence vs. power for different dyes and different pulse durations. (e) Bleaching vs. power for different dyes and different pulse durations. Note the log-log representation of data in (d,e).

