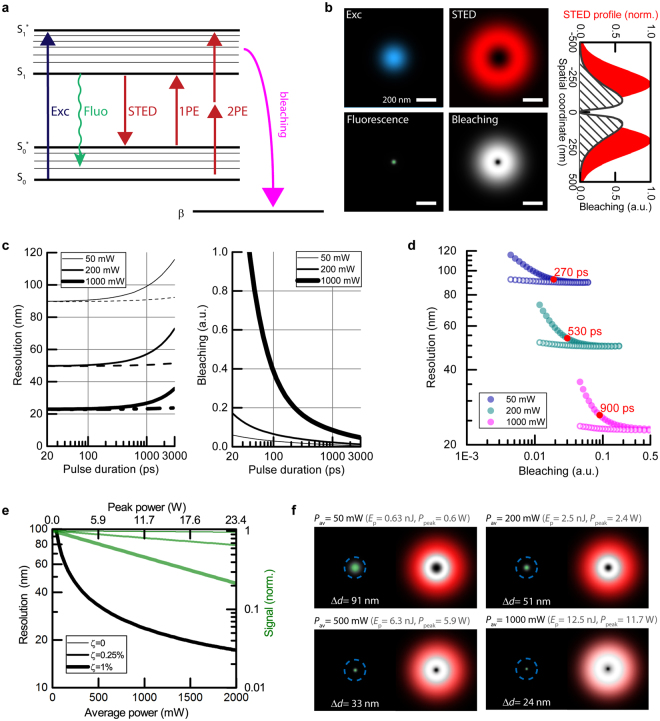
Figure 5.
Simulation of the STED performance at 750 nm in imaging (based on parameters derived from measurements with ATTO647N). (a) Simplified model of de-excitation, bleaching and STED-light-mediated 1-photon (1PE) and 2-photon (2PE) excitation processes. (b) Focal-plane excitation (Exc) and STED spatial profiles (top). Resulting fluorescence and probability of photobleaching (bottom), shown here for a STED pulse duration of τ = 200 ps and average power P = 450 mW (80 MHz repetition rate). (c) Resolution and bleaching as a function of pulse duration for three time-averaged STED powers. The dashed lines represent gated detection. (d) The same data as in c presented as resolution vs. bleaching. The lowest bleaching and the highest resolution can be obtained by adjusting the STED pulse duration and applying gated detection (hollow points, tgate = τ). (e) Influence of residual STED intensity ζ at the targeted coordinate (intensity minimum) on resolution and fluorescence signal amplitude for three different levels: 0, 0.0025 and 0.01 of doughnut crest intensity. STED pulse duration: τ = 1000 ps, gated detection tgate = τ. 1000 mW at 80 MHz repetition rate (this simulation) correspond in terms of pulse energy and peak power to 250 mW at 20 MHz, a common repetition rate for STED with nanosecond pulses. Note that the three black curves (resolution) overlap. (f) Spatial distribution of fluorescence (green), normalized probabilities of photobleaching (grey scale, with highest photobleaching in white) and normalized STED beam profile as reference (red) for different average STED powers (STED pulse duration: τ = 1000 ps). The stated resolution values Δd represent the respective FWHM of the fluorescence profile.

