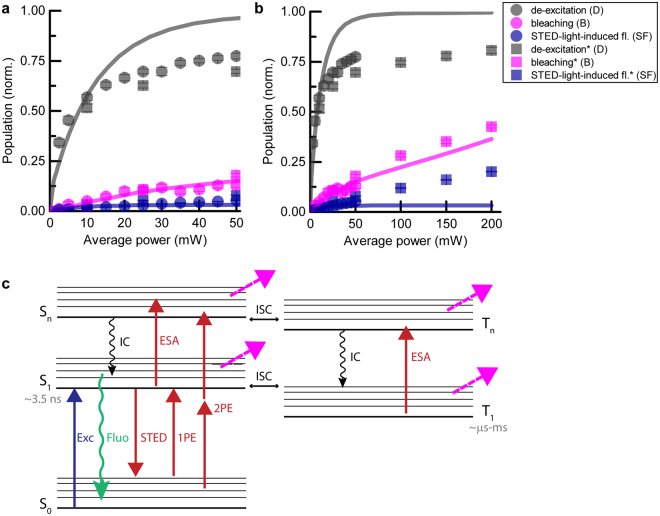
Figure 6.
Limitations of the photobleaching model in explaining the data at high STED powers (ATTO647N) (see text). (a,b) Comparison between experimental and modelled data for de-excitation, bleaching and STED-light-induced fluorescence vs. STED power. (a) represents a subset of the data shown in (b). Circles and squares correspond to two independent measurement series). (c) Extended model of states possibly involved in photobleaching32, including an additional excited singlet state Sn, and two triplet states T1 and Tn. ISC: intersystem crossing; IC: internal conversion; ESA: excited-state absorption processes.

