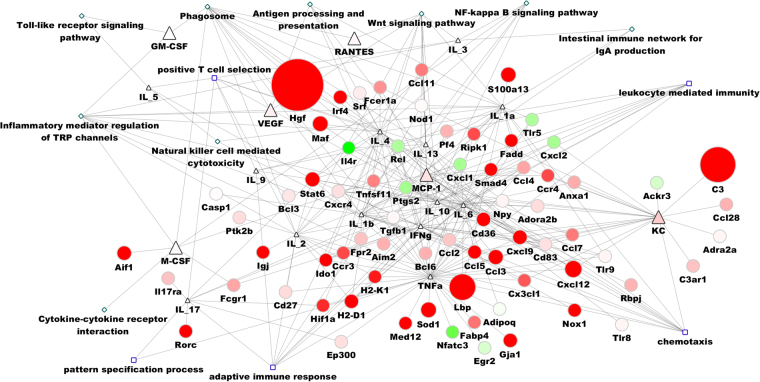
Figure 3.
Regulation model of cytokines and transcripts related to cytokine genes. The triangle denotes cytokines; the circle indicates genes that have the potential to interact with cytokines and were detected by RNA-seq; the diamond denotes the KEGG pathway; and the rectangle indicates biological processes. Red represents up-regulation, green indicates down-regulation, and the node size represents the level of fold change in expression. Hgf, C3, and Lbp were substantially increased, which was related to IL-4, KC and TNFα. In contrast, some genes (e.g., CXCL1, CXCL2, and TLR5) decreased significantly.

