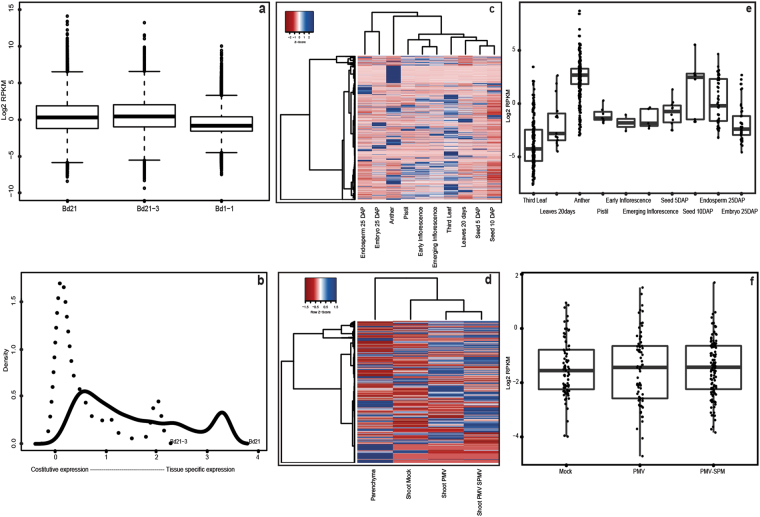
Figure 5.
LncRNAs expression profiles in Bd lines. (a) Boxplot of lncRNAs expression in Bd21, Bd21-3 and Bd1-1. Expression values are shown as Log2 of RPKM (Reads Per Kilobase per Million mapped reads). LncRNAs not expressed (RPKM = 0) were excluded. (b) The Shannon entropy distribution of Bd21 and Bd21-3 lncRNAs. The black line corresponds to Bd21 lncRNAs and the dot line to Bd21-3 lncRNAs. (c,d) Hierarchical clustering (Ward method) of Bd21 lncRNAs (c) and Bd21-3 lncRNAs (d) expression profiles. LncRNAs expression levels were scaled to Z score. Blue indicates high expression level, red low expression. (e,f) Boxplots displaying abundance of specific lncRNAs in Bd21 (e) and Bd21-3 (f). RPKM expression values are shown as log2 and black dots correspond to individual lncRNA. Parenchyma tissue is not shown in the Bd21-3 boxplot.

