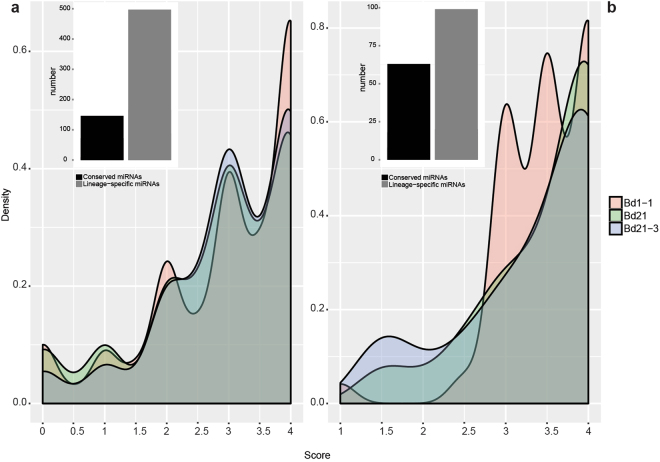
Figure 6.
Score values resulting from in silico prediction of lncRNAs target of microRNAs and lncRNAs acting as target mimicry. (a) Distribution of scores obtained from TargetFinder analyses of lncRNAs identified as target of microRNAs. The bar-plot shows the number of conserved and lineage-specific microRNAs Bd families predicted by TargetFinder with a score 2. (b) Score of lncRNAs identified as sponge of microRNAs by psMimic. The bar-plot shows the number of conserved and lineage-specific Bd microRNAs families regulated by lncRNAs. In both density plots lines correspond to each of the inbred line Bd21, Bd21-3 and Bd1-1.

