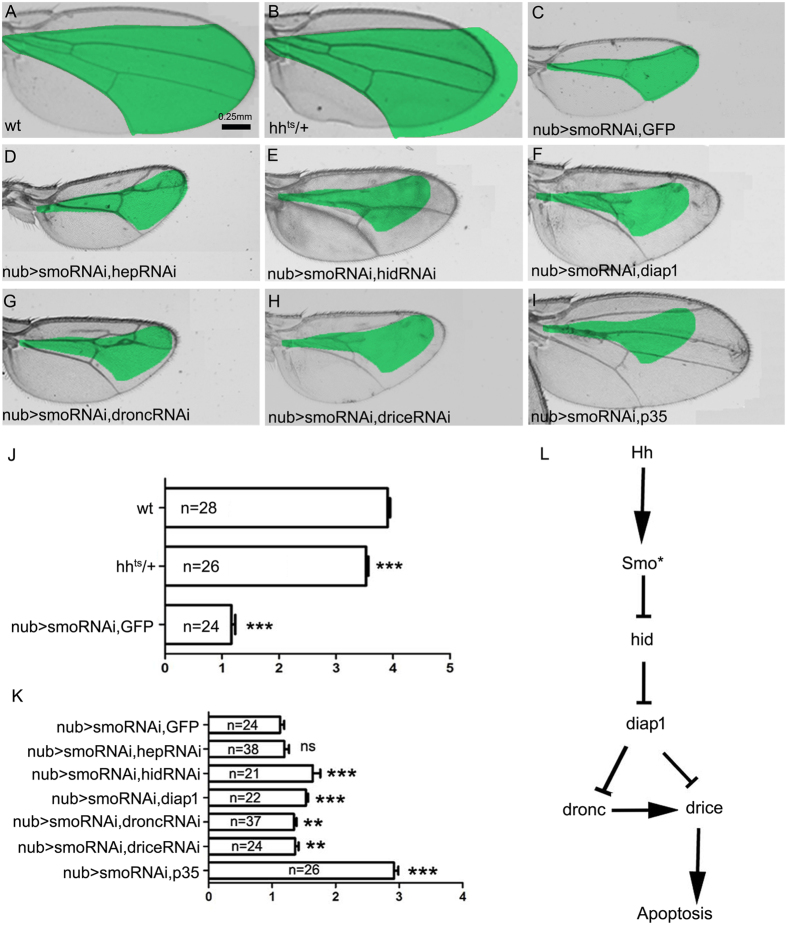
Figure 5.
The phenotypes of adult wings. (A) Wild-type adult wing. The area between L2 and L5 veins is measured. The region between L2 and L5 veins of each control wing (A and C) is marked in green and compared in each manipulation (B,D–H) because most of the cell death induced by the suppression of Hh signalling occurs in the presumptive region between the L2 and L5 veins. (B) The hh ts adult wing is smaller than the wild-type wing (A). (D) Co-expressing hep-RNAi does not rescue the small size between L2 and L5 compared with the expression of smo-RNAi (C). (E) Co-expressing hid-RNAi increases the indicated area compared with the control wing in C. (F) Co-expressing diap1 increases the indicated area compared with the control wing in C. (G) Co-expressing dronc-RNAi increases the indicated area compared with the control wing in C. (H) Co-expressing drice-RNAi increases the indicated area compared with the control wing in C. (I) The wing area is rescued by co-overexpressing P35. (J and K) Statistics for the green-marked wing regions in each genotype mentioned above. Means ± SEM indicated by ** or *** are significantly different (pairwise comparisons performed using t-tests, p < 0.001 or p < 0.0001). (L) A model of the genetic pathway regulating cell survival by Hh signalling.

