
Fig. 2.
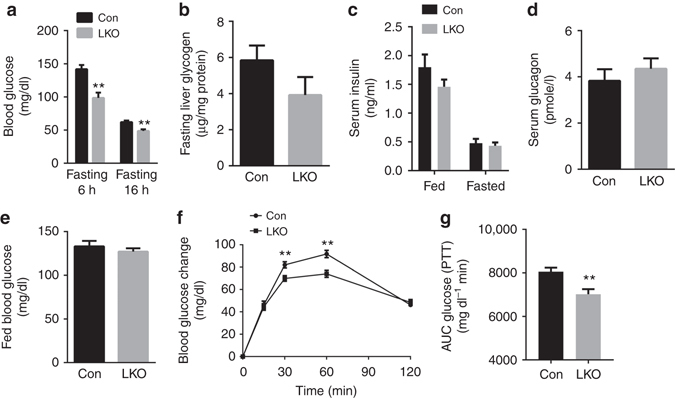
GCN5L1 LKO mice displayed decreased fasting blood glucose levels. 8–10 weeks male mice fed with normal chow were studied. a Blood glucose levels were measured under fasting conditions. Mice were fasted for 6 or 16 h (n = 7). b–d Liver glycogen content after 6 h fasting (n = 5) (b), fed and overnight fasted serum insulin (n = 7) (c) and serum glucagon levels after 6 h of fasting (n = 5) (d). e Blood glucose levels were measured under fed conditions (n = 6). f, g Pyruvate tolerance test (PTT) and area under the curve of blood glucose levels (n = 18). Values are expressed as mean ± s.e.m. **P < 0.01 versus respective control groups by the Student’s t-test